Fig. 4.
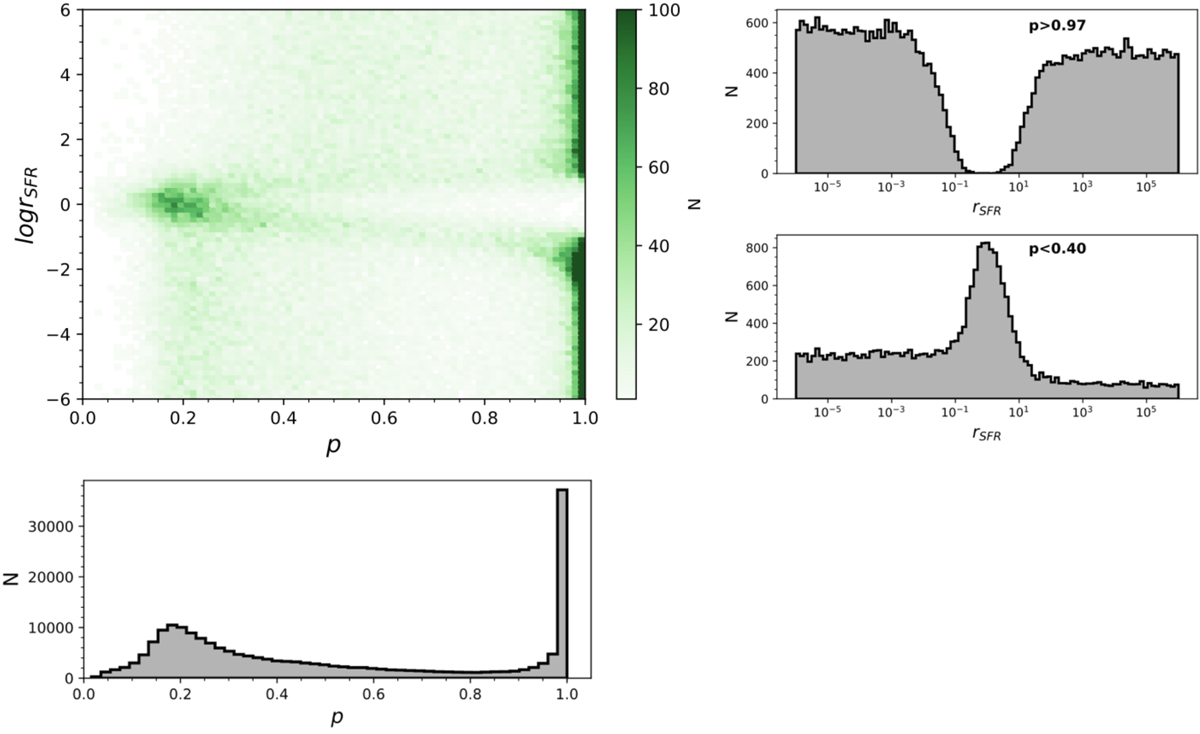
Study of the statistical power of ![]() to detect short-term variations with respect to the value of rSFR. Top left panel: joint distribution of
to detect short-term variations with respect to the value of rSFR. Top left panel: joint distribution of ![]() and rSFR. Bottom left panel: distribution of
and rSFR. Bottom left panel: distribution of ![]() obtained with x coming from the test catalog. Right panels: marginal distributions of rSFR for mock sources with
obtained with x coming from the test catalog. Right panels: marginal distributions of rSFR for mock sources with ![]() (top right panel) and for mock sources with
(top right panel) and for mock sources with ![]() (bottom right panel).
(bottom right panel).
Current usage metrics show cumulative count of Article Views (full-text article views including HTML views, PDF and ePub downloads, according to the available data) and Abstracts Views on Vision4Press platform.
Data correspond to usage on the plateform after 2015. The current usage metrics is available 48-96 hours after online publication and is updated daily on week days.
Initial download of the metrics may take a while.