Open Access
Fig. 3.
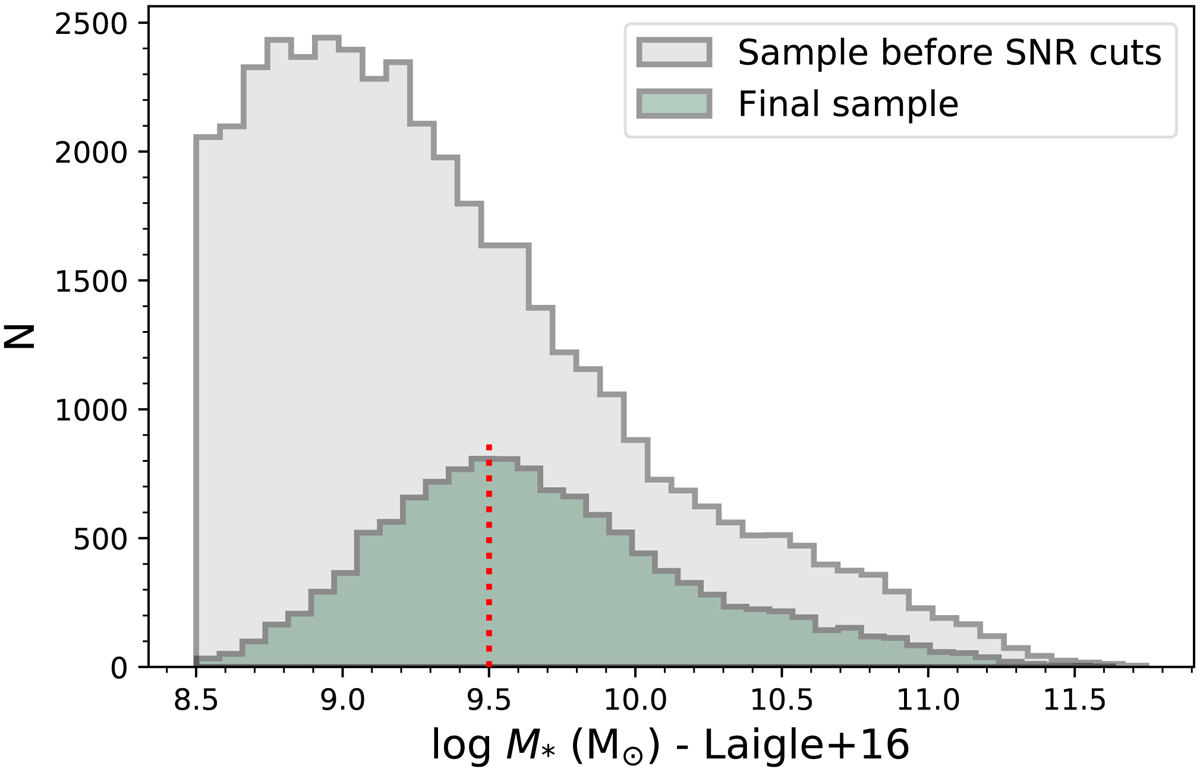
Distribution of stellar mass for the sample before the S/N cut (gray) and the final sample (green). The red dotted line indicates the limit above which our final sample is considered complete. The stellar masses indicated here are from Laigle et al. (2016).
Current usage metrics show cumulative count of Article Views (full-text article views including HTML views, PDF and ePub downloads, according to the available data) and Abstracts Views on Vision4Press platform.
Data correspond to usage on the plateform after 2015. The current usage metrics is available 48-96 hours after online publication and is updated daily on week days.
Initial download of the metrics may take a while.