Fig. 4.
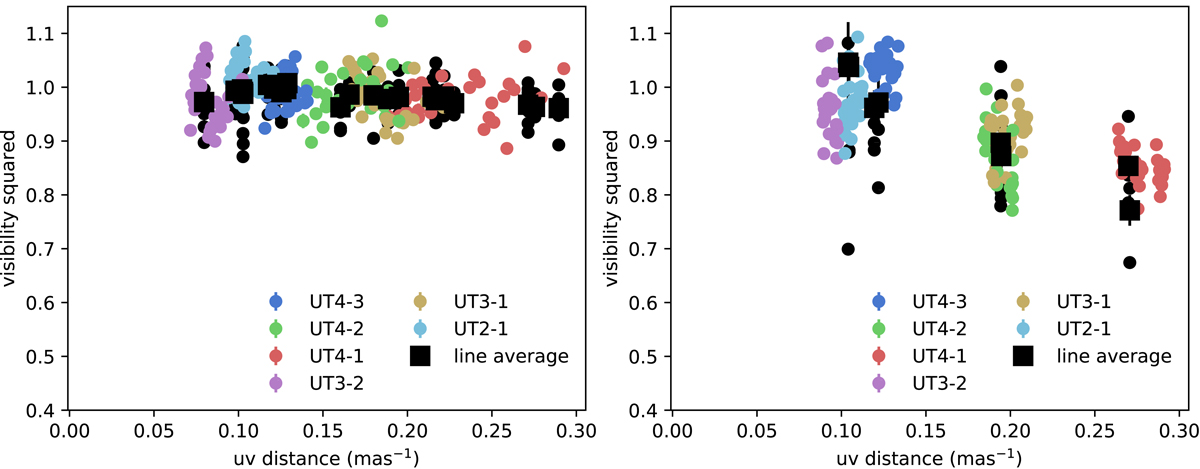
Sample squared visibilities measured for FT (small circles colored by baseline) compared to those derived from SC differential amplitudes (black circles and their averages as large squares) for 3C 273 (left) and IRAS 09149−6206 (right). The FT data have been divided by the best-fitting zero-baseline visibility, so that V2(0) = 1. With this scaling, the two independent measurements are generally consistent.
Current usage metrics show cumulative count of Article Views (full-text article views including HTML views, PDF and ePub downloads, according to the available data) and Abstracts Views on Vision4Press platform.
Data correspond to usage on the plateform after 2015. The current usage metrics is available 48-96 hours after online publication and is updated daily on week days.
Initial download of the metrics may take a while.