Fig. 3.
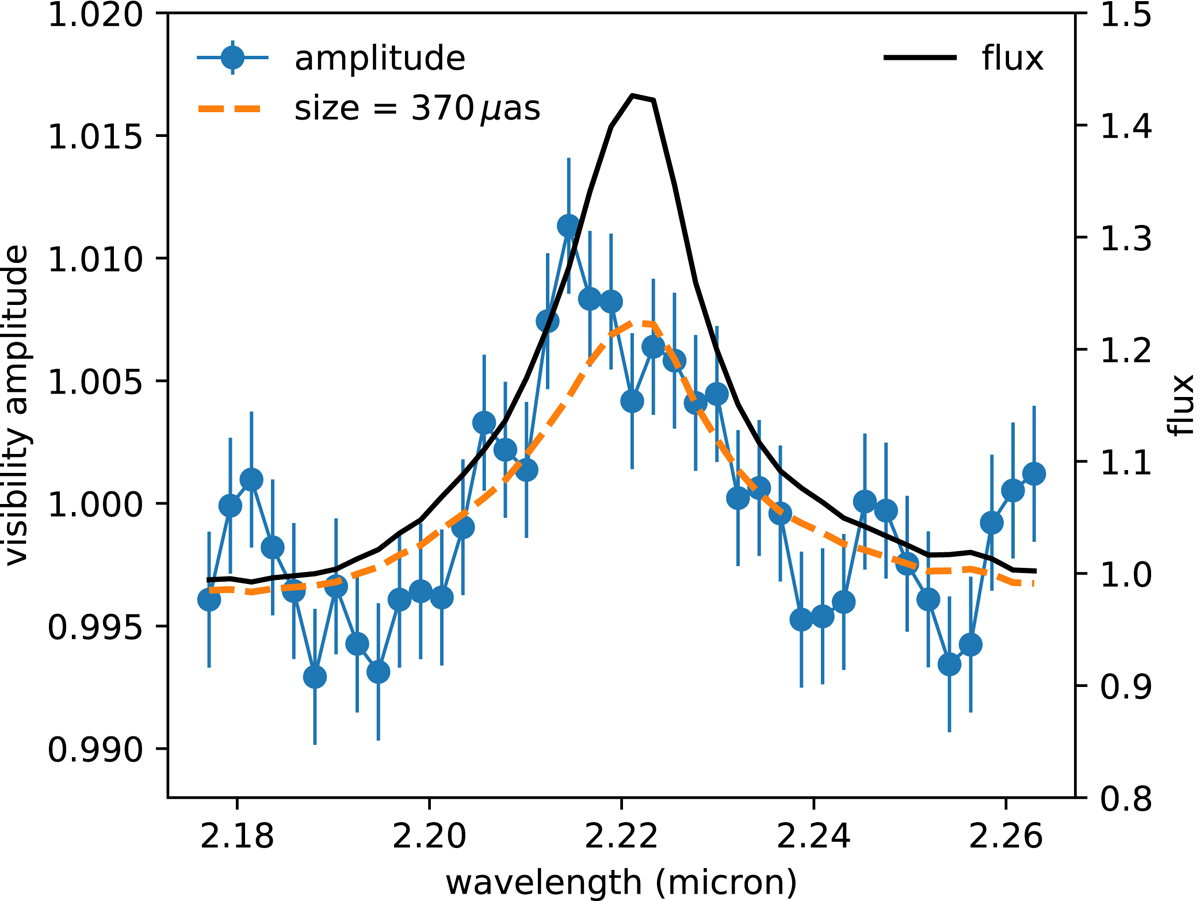
Differential visibility amplitude vs. wavelength for PDS 456 from 2018 August 26 averaged over long baselines (blue circles and error bars) compared with the photometric flux. The orange curve shows a model of an unresolved BLR and a Gaussian continuum. The rise of the differential amplitude following the shape of the line is consistent with a partially resolved continuum, and its amplitude allows an independent measurement of continuum hot dust size.
Current usage metrics show cumulative count of Article Views (full-text article views including HTML views, PDF and ePub downloads, according to the available data) and Abstracts Views on Vision4Press platform.
Data correspond to usage on the plateform after 2015. The current usage metrics is available 48-96 hours after online publication and is updated daily on week days.
Initial download of the metrics may take a while.