Fig. 2.
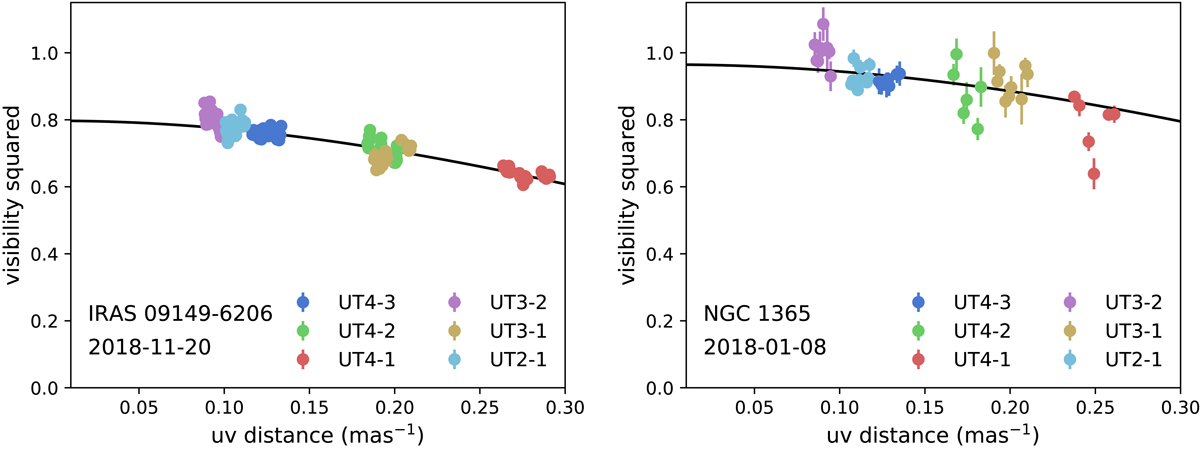
Sample calibrated V2 GRAVITY FT data as a function of baseline length for single-epoch observations of two sources. The data pointed are color-coded by baseline. In both cases the sources are partially resolved, e.g., the visibilities fall with baseline length. For NGC 1365 on 2018 January 8, the V2 approaches 1 at short baselines. For IRAS 09149-6206 on 2018 November 20, the short baselines remain significantly below V2 = 1. The black lines are the best -fitting 1D Gaussian models for each epoch.
Current usage metrics show cumulative count of Article Views (full-text article views including HTML views, PDF and ePub downloads, according to the available data) and Abstracts Views on Vision4Press platform.
Data correspond to usage on the plateform after 2015. The current usage metrics is available 48-96 hours after online publication and is updated daily on week days.
Initial download of the metrics may take a while.