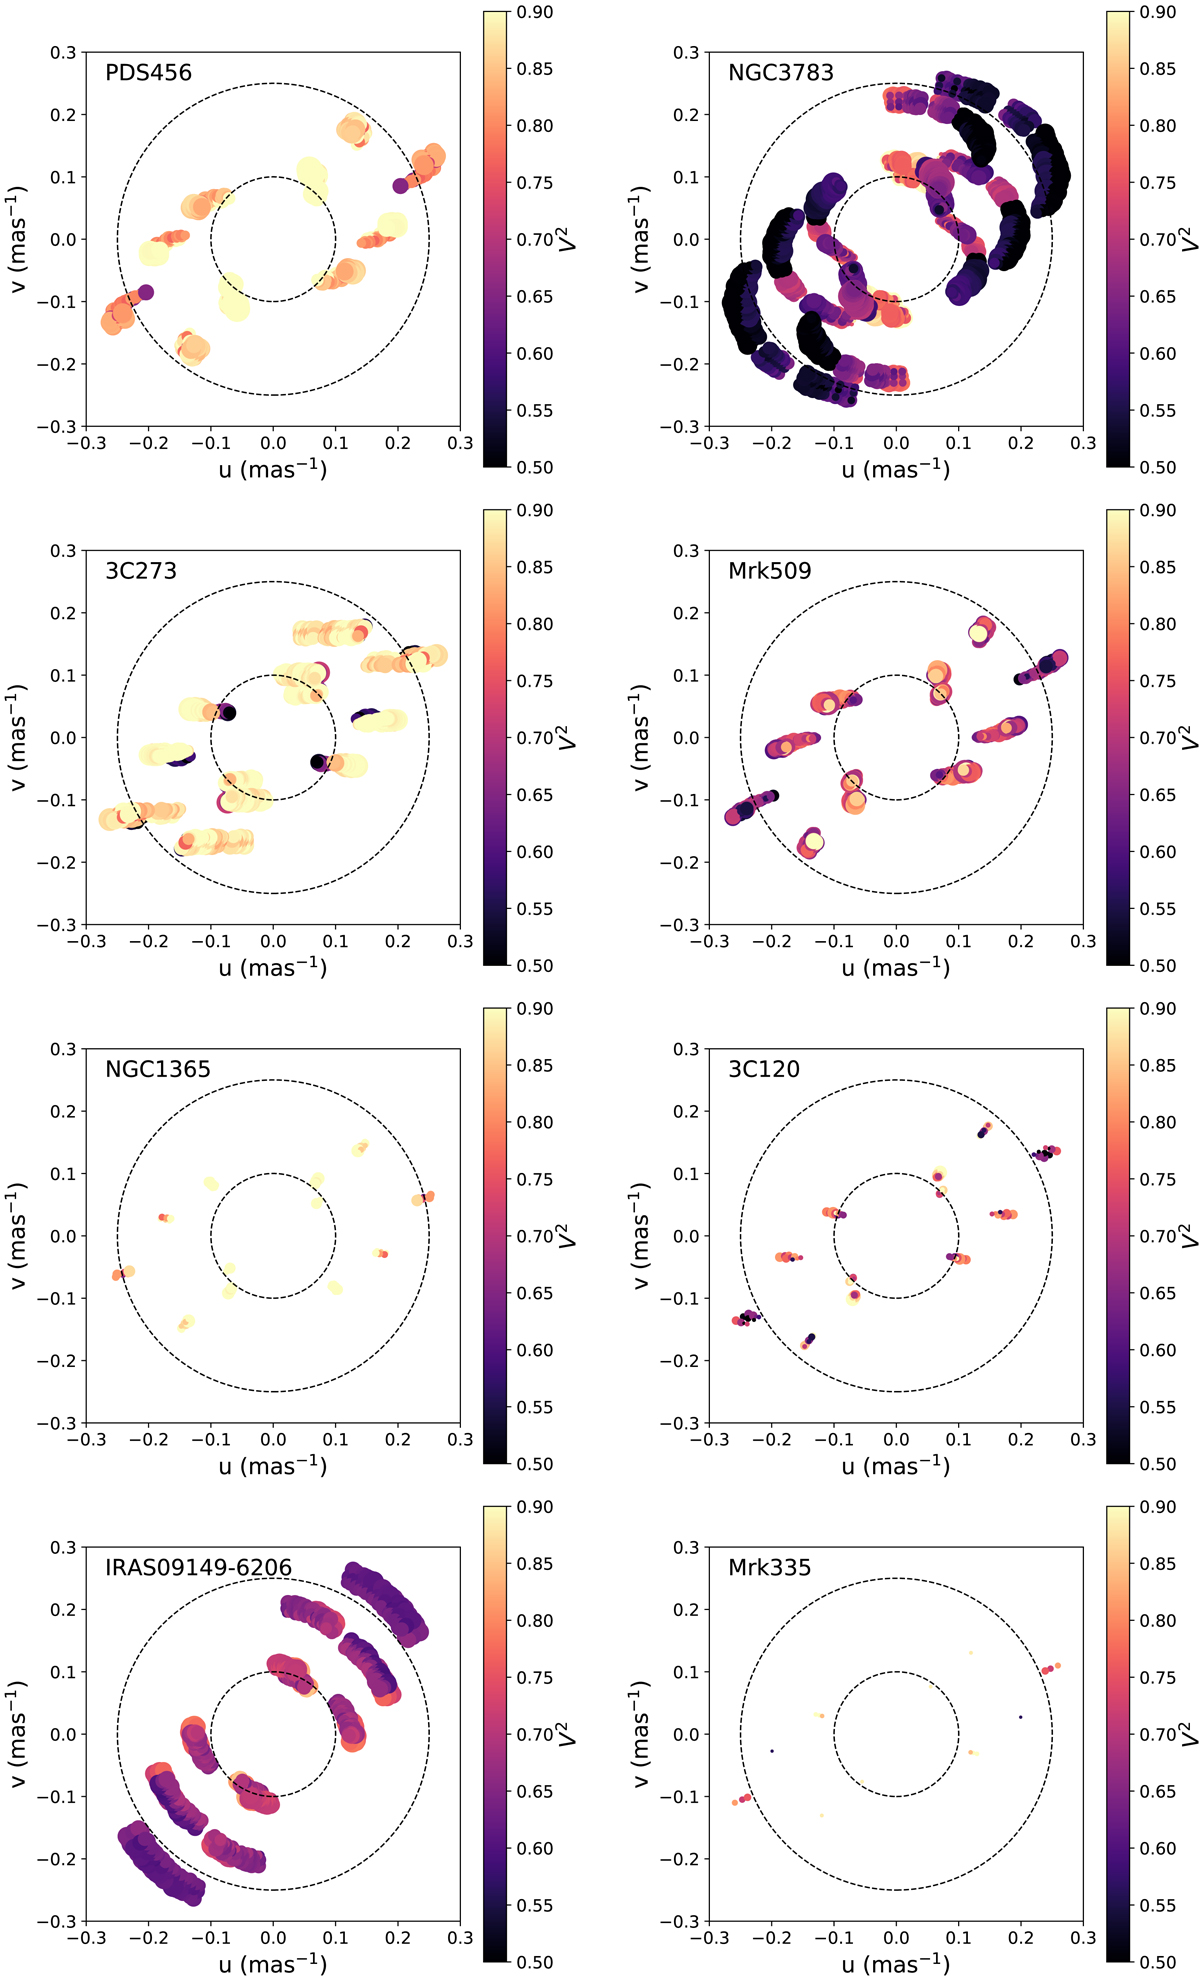
Fig. B.1.

2D maps of V2 (colors) are shown for each source as a function of observed uv coordinates. The point size is proportional to its signal-to-noise ratio. All sources are partially resolved (on average, lighter colors closer to the origin), without clear evidence of elongation (systematic variation of V2 with position angle), except potentially for NGC 3783. The inner and outer dashed circles show baseline resolutions of 10 and 4 mas.
Current usage metrics show cumulative count of Article Views (full-text article views including HTML views, PDF and ePub downloads, according to the available data) and Abstracts Views on Vision4Press platform.
Data correspond to usage on the plateform after 2015. The current usage metrics is available 48-96 hours after online publication and is updated daily on week days.
Initial download of the metrics may take a while.


