Fig. 1.
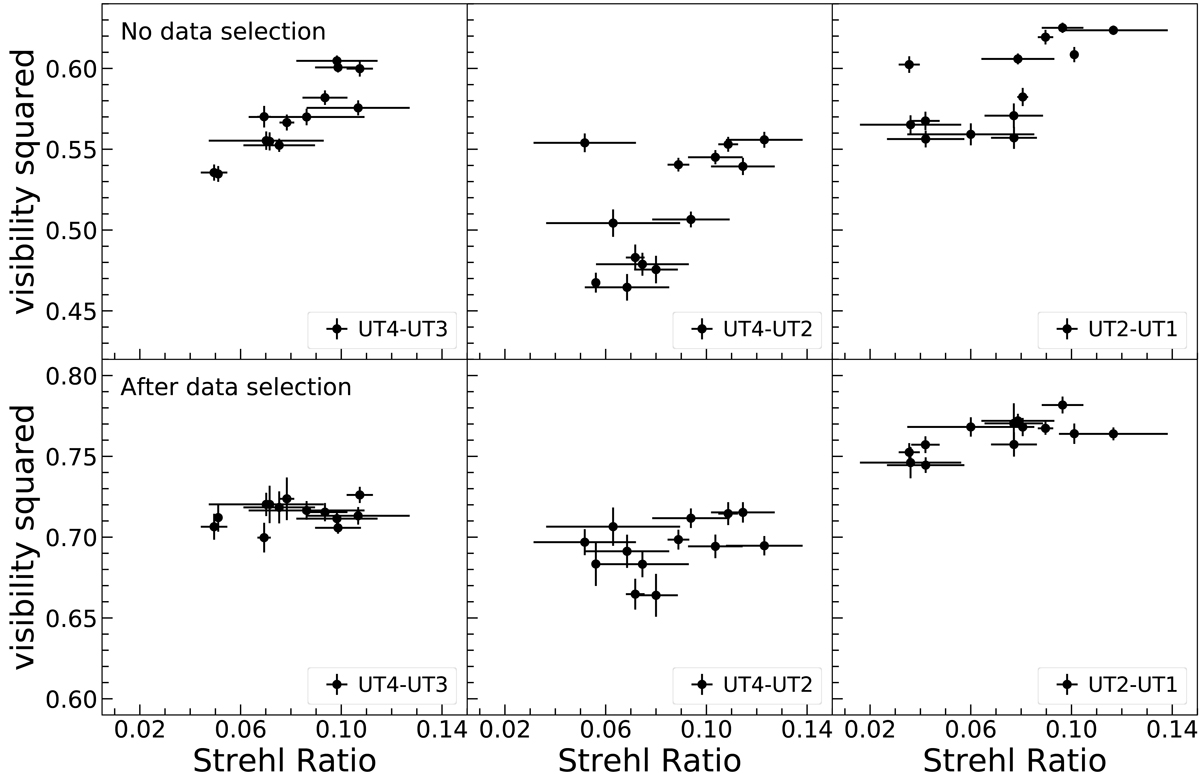
Sample V2 data of PDS 456 on 2018-08-27 before (top) and after (bottom) selecting data with a group delay of < 3 μm. Without the data selection, the averaged visibility squared data are ≲0.65. There is also a trend that the visibility squared increases as the Strehl ratio increases for each baseline. In contrast, the visibility squared reaches ≃0.7−0.8 after the data selection, with no clear trend with Strehl ratio.
Current usage metrics show cumulative count of Article Views (full-text article views including HTML views, PDF and ePub downloads, according to the available data) and Abstracts Views on Vision4Press platform.
Data correspond to usage on the plateform after 2015. The current usage metrics is available 48-96 hours after online publication and is updated daily on week days.
Initial download of the metrics may take a while.