Fig. 9
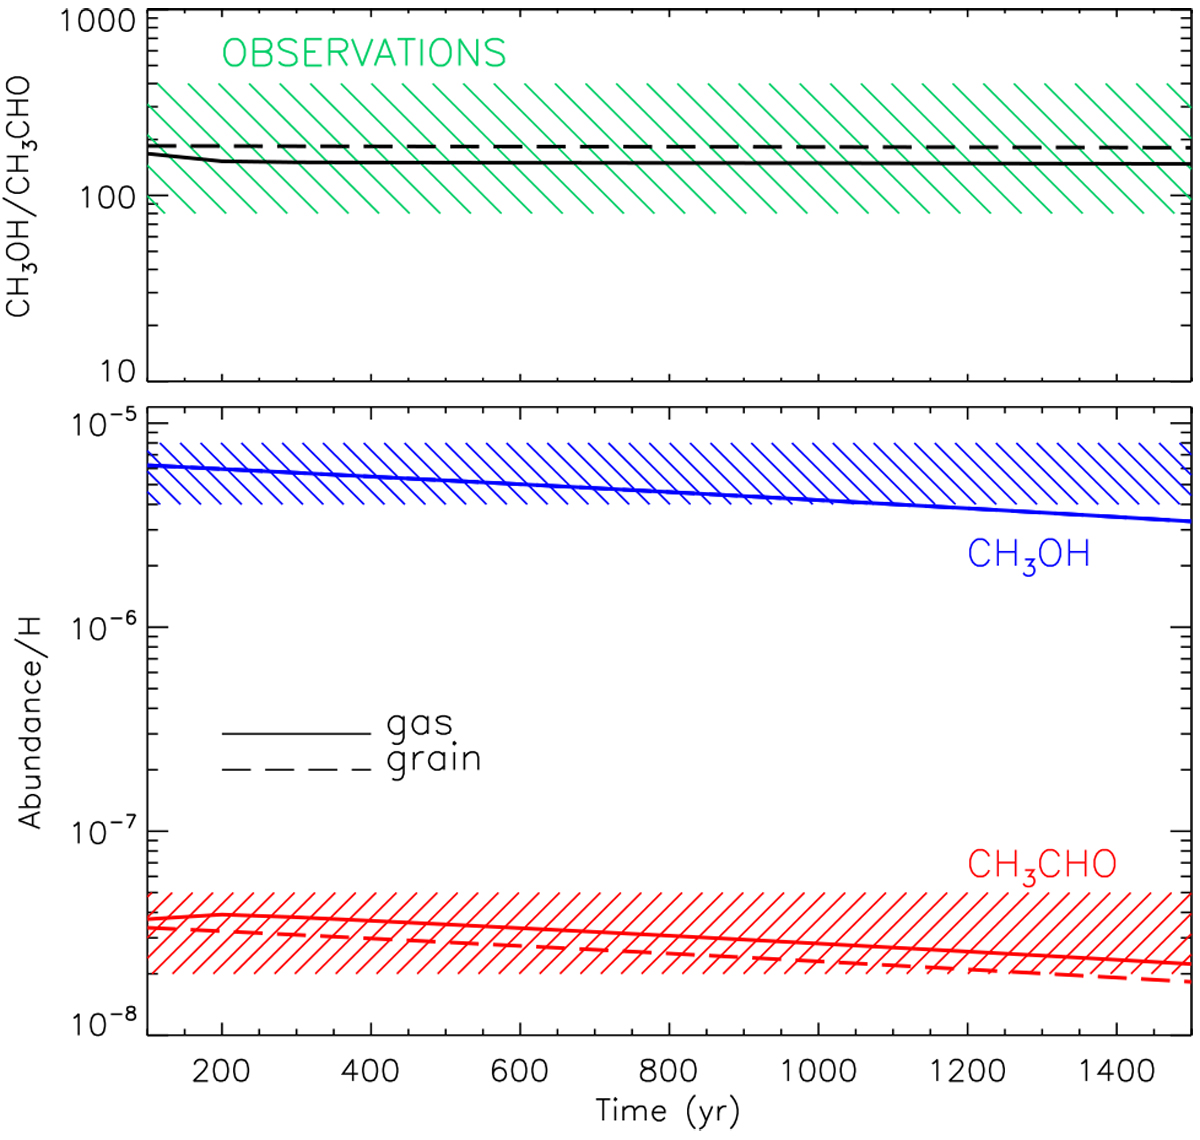
Model predictions of methanol and acetaldehyde after a shock passage. Upper panel: CH3 OH/CH3CHO abundance ratio: solid line refers to a model where acetaldehyde is synthesised in the gas phase, whereas the dashed line refers to predictions assuming that CH3 OH is injected into the gas phase directly from the grain mantles. The hatched green zone is defined by the value (including uncertainty) measured towards the B1b peak, with a kinematical age of ≃ 1100 yr (Podio et al. 2016, revised according to the new distance of 352 pc by Zucker et al. 2019). Lower panel: acetaldehyde (CH3 CHO, red) and methanol (CH3OH, blue) abundances with respect to H nuclei as a function of time from the passage of the shock. The hatched blue and red regions show the measurements towards B1b (see text).
Current usage metrics show cumulative count of Article Views (full-text article views including HTML views, PDF and ePub downloads, according to the available data) and Abstracts Views on Vision4Press platform.
Data correspond to usage on the plateform after 2015. The current usage metrics is available 48-96 hours after online publication and is updated daily on week days.
Initial download of the metrics may take a while.