Fig. 8
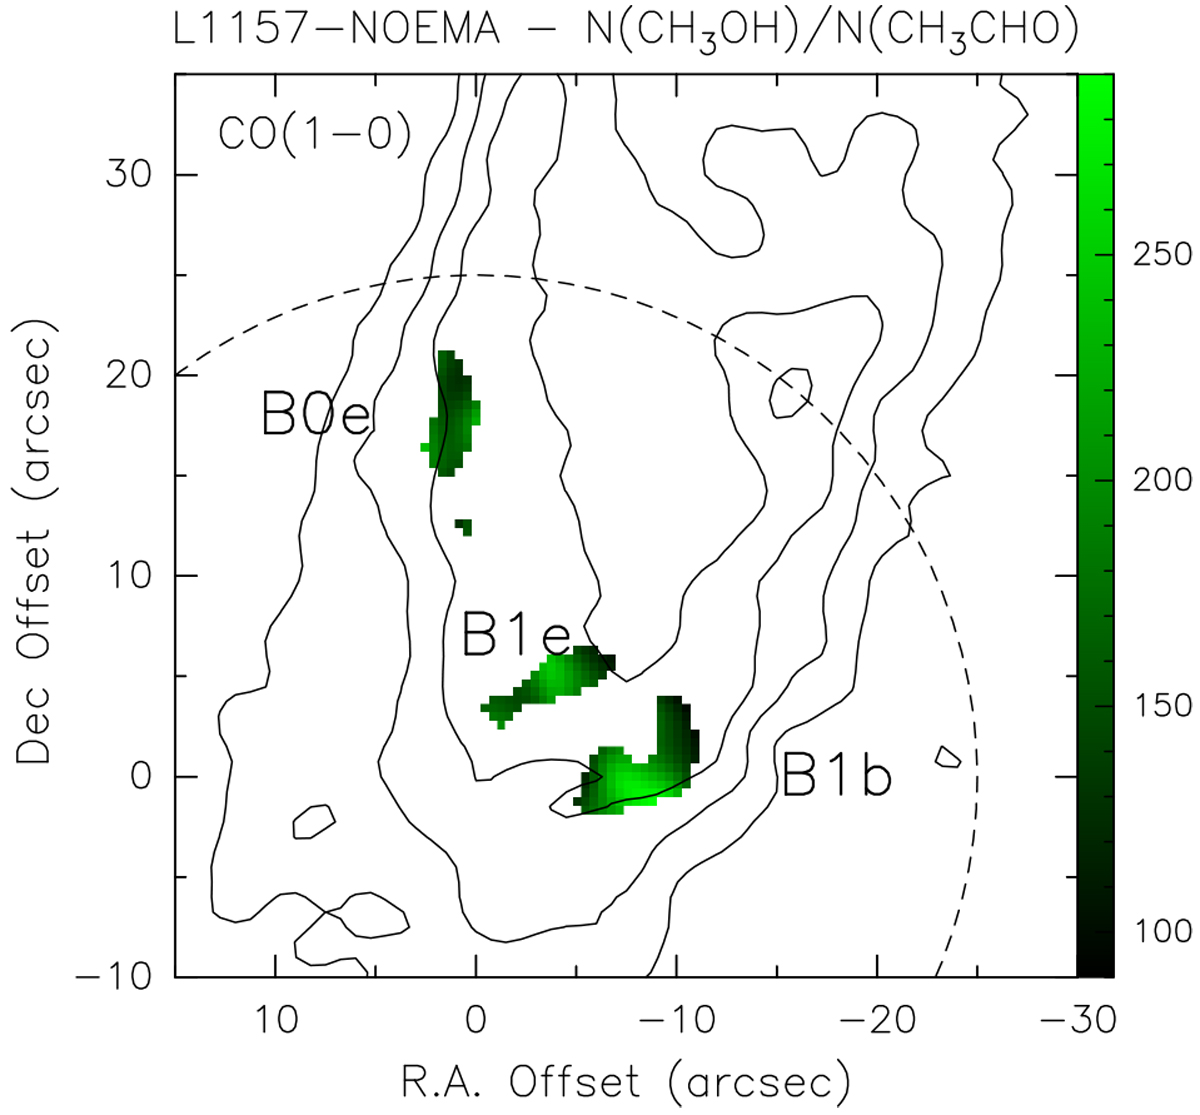
Map of the ratio between the CH3OH and CH3CHO column density of the B0 and B1 region of the L1157 outflow (derived from the NOEMA images, where the emission is at least 3σ), overlaid on the CO (black contours; Gueth et al. 1996) emission map. Uncertainties are ≃ 30% (i.e. 30–100 in absolute values). Symbols are as in Fig. 1.
Current usage metrics show cumulative count of Article Views (full-text article views including HTML views, PDF and ePub downloads, according to the available data) and Abstracts Views on Vision4Press platform.
Data correspond to usage on the plateform after 2015. The current usage metrics is available 48-96 hours after online publication and is updated daily on week days.
Initial download of the metrics may take a while.