Fig. 4
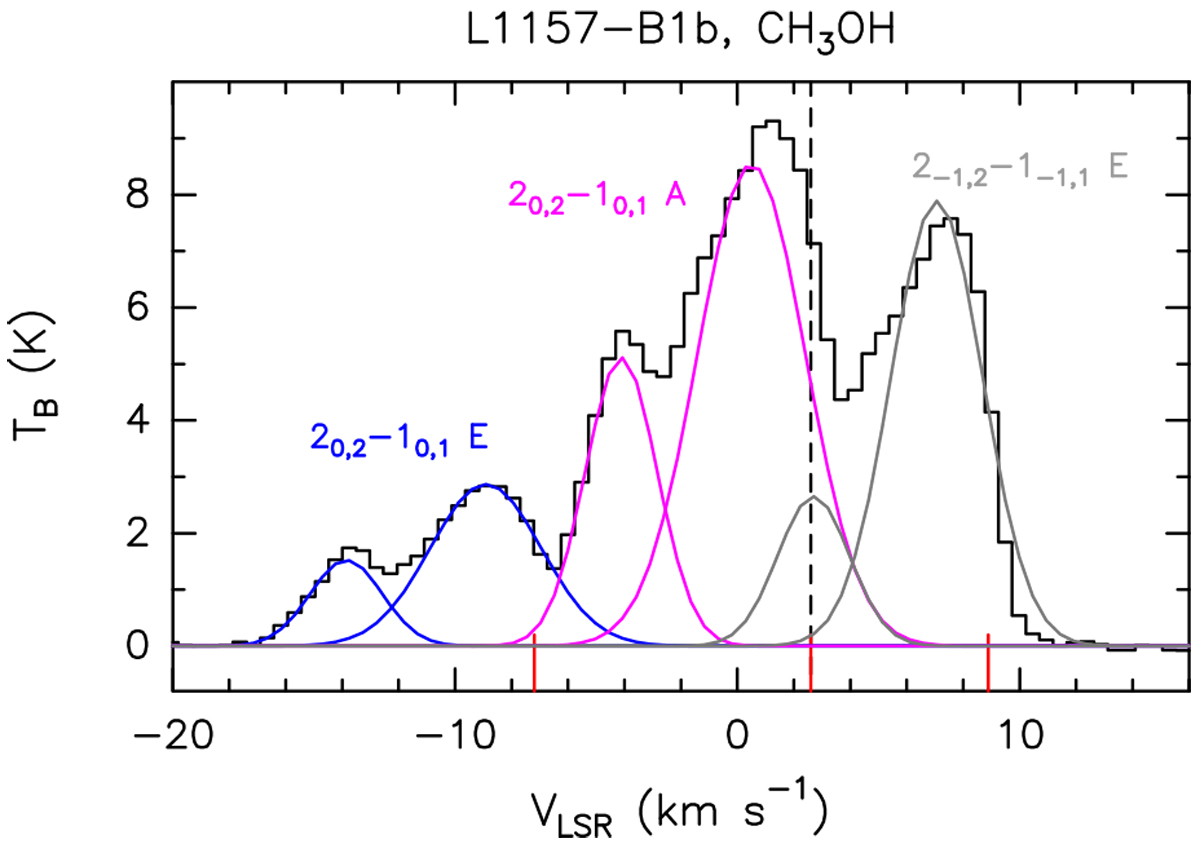
Spectral fit of the 2-1,2–1-1,1 E (grey lines), 20,2–10,1 A (magenta), and 20,2–10,1 E (blue) triplets as observed towards B1b using the NOEMA narrow-band spectrometer. The spectra are centred at the frequency of the 20,2–10,1 A transition: 96 741.38 MHz. The transitions producing the emission lines (see Table 1) are reported, with the corresponding frequencies marked by small vertical red lines. The dashed vertical line is for the systemic velocity: +2.6 km s−1 (e.g. Bachiller et al. 2001). Each transition shows a main peak at +0.5 km s−1 plus a secondary peak further blueshifted by ~5 km s−1.
Current usage metrics show cumulative count of Article Views (full-text article views including HTML views, PDF and ePub downloads, according to the available data) and Abstracts Views on Vision4Press platform.
Data correspond to usage on the plateform after 2015. The current usage metrics is available 48-96 hours after online publication and is updated daily on week days.
Initial download of the metrics may take a while.