Fig. 2
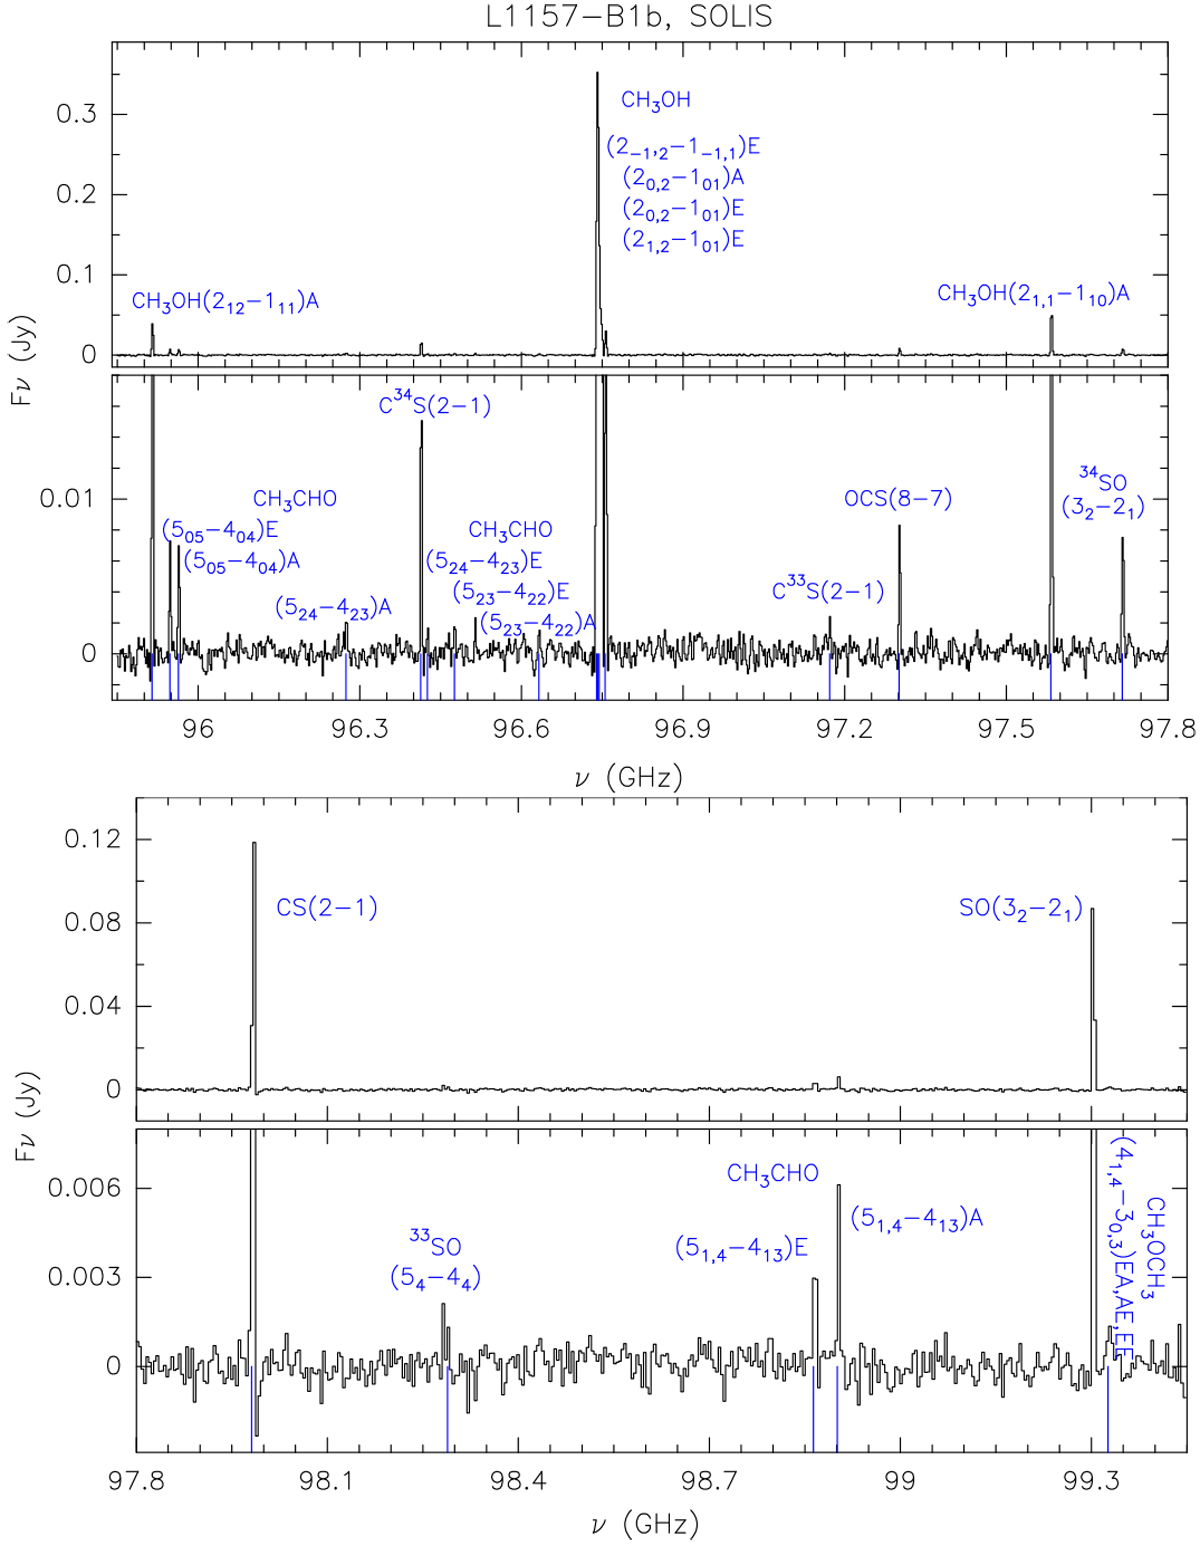
Upper and lower panels: IRAM-WideX spectra (in Fν scale) extracted at the L1157-B1b blueshifted position (see Fig. 1 and text). The spectral resolution is 1.95 MHz (see Sect. 3). A zoom-in in intensity is shown so that the weakest lines can be seen. The transitions producing the emission lines are labelled in blue, with the corresponding frequencies marked by vertical blue lines. The detected CH3OH and CH3COH lines (analysed here) are reported in Table 1.
Current usage metrics show cumulative count of Article Views (full-text article views including HTML views, PDF and ePub downloads, according to the available data) and Abstracts Views on Vision4Press platform.
Data correspond to usage on the plateform after 2015. The current usage metrics is available 48-96 hours after online publication and is updated daily on week days.
Initial download of the metrics may take a while.