Fig. A.1
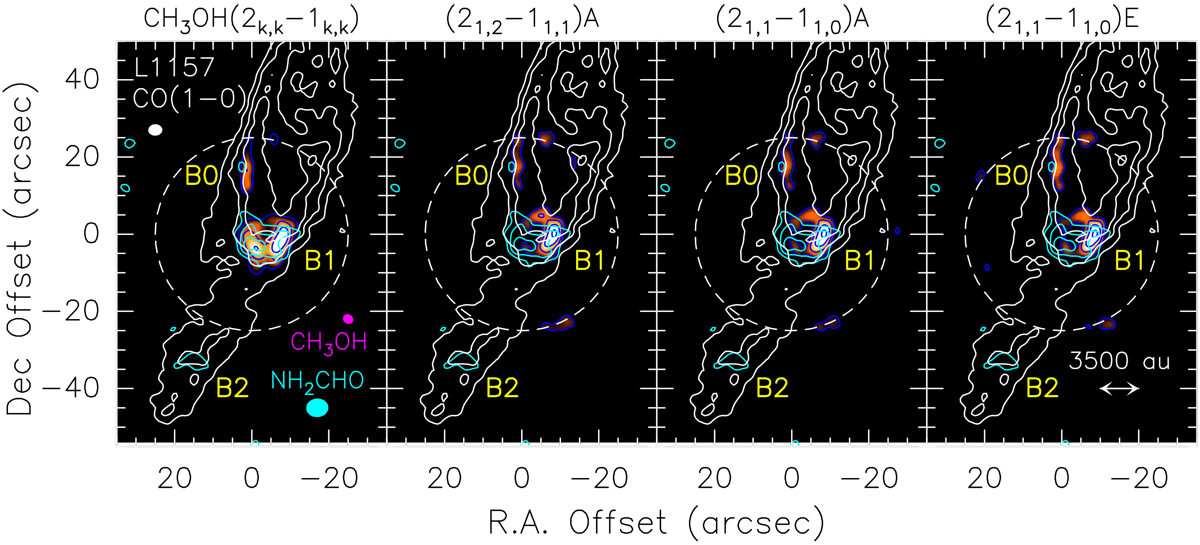
L1157 southern blueshifted lobe in CO (1–0) (white contours; Gueth et al. 1996) and NH2 CHO (41,4 –31,3) (cyan contours; Codella et al. 2017). The precessing jet ejected by the central object L1157-mm (outside the frame and toward the northwest) excavated several clumpy cavities, named B0, B1, and B2, respectively. The maps are centred at α(J 2000) = 20h 39m10s.2, δ(J 2000) = +68°01′10′′.5 (Δα = +25′′ and Δδ = –63′′.5 from the L1157-mm protostar). Map (in colour scale) of the sum of the CH3 OH (2-1,2 –1-1,1) E, (20,2 –10,1) A, and (20,2–10,1) E emission lines (labelled 2k,k–1k,k), (21,2 –11,1) A, (21,1–11,0) A, and (21,1–11,0) E (integrated over the whole velocity range). For the CO image, the first contour and step are 6σ (1σ = 0.5 Jy beam−1 km s−1) and 4σ, respectively. The first contour and step of the NH2CHO map (cyan contours) correspond to 3σ (15 mJy beam−1 km s−1) and 1σ, respectively. The dashed circle shows the primary beam of the CH3OH images (64′′). The first contour and step are 3σ (56, 32, 45, and 23 mJy beam−1 km s−1 for 2k,k –1k,k, 21,2 –11,1 A, 21,1 –11,0 A, and (21,1–11,0) E, respectively. Yellow labels are for the B0, B1, and B2 regions: the positions of the different clumps inside these regions are shown in Fig. 1 (see also text, and e.g. Codella et al. 2009, 2017). The cyan, white, and magenta ellipses depict the synthesised beams of the NH2 CHO (5′′.79 × 4′′.81, PA = –94°), CO (3′′.65 × 2′′.96, PA = +88°), and CH3OH (2′′.97 × 2′′.26, PA = –155°) observations, respectively.
Current usage metrics show cumulative count of Article Views (full-text article views including HTML views, PDF and ePub downloads, according to the available data) and Abstracts Views on Vision4Press platform.
Data correspond to usage on the plateform after 2015. The current usage metrics is available 48-96 hours after online publication and is updated daily on week days.
Initial download of the metrics may take a while.