Fig. 1
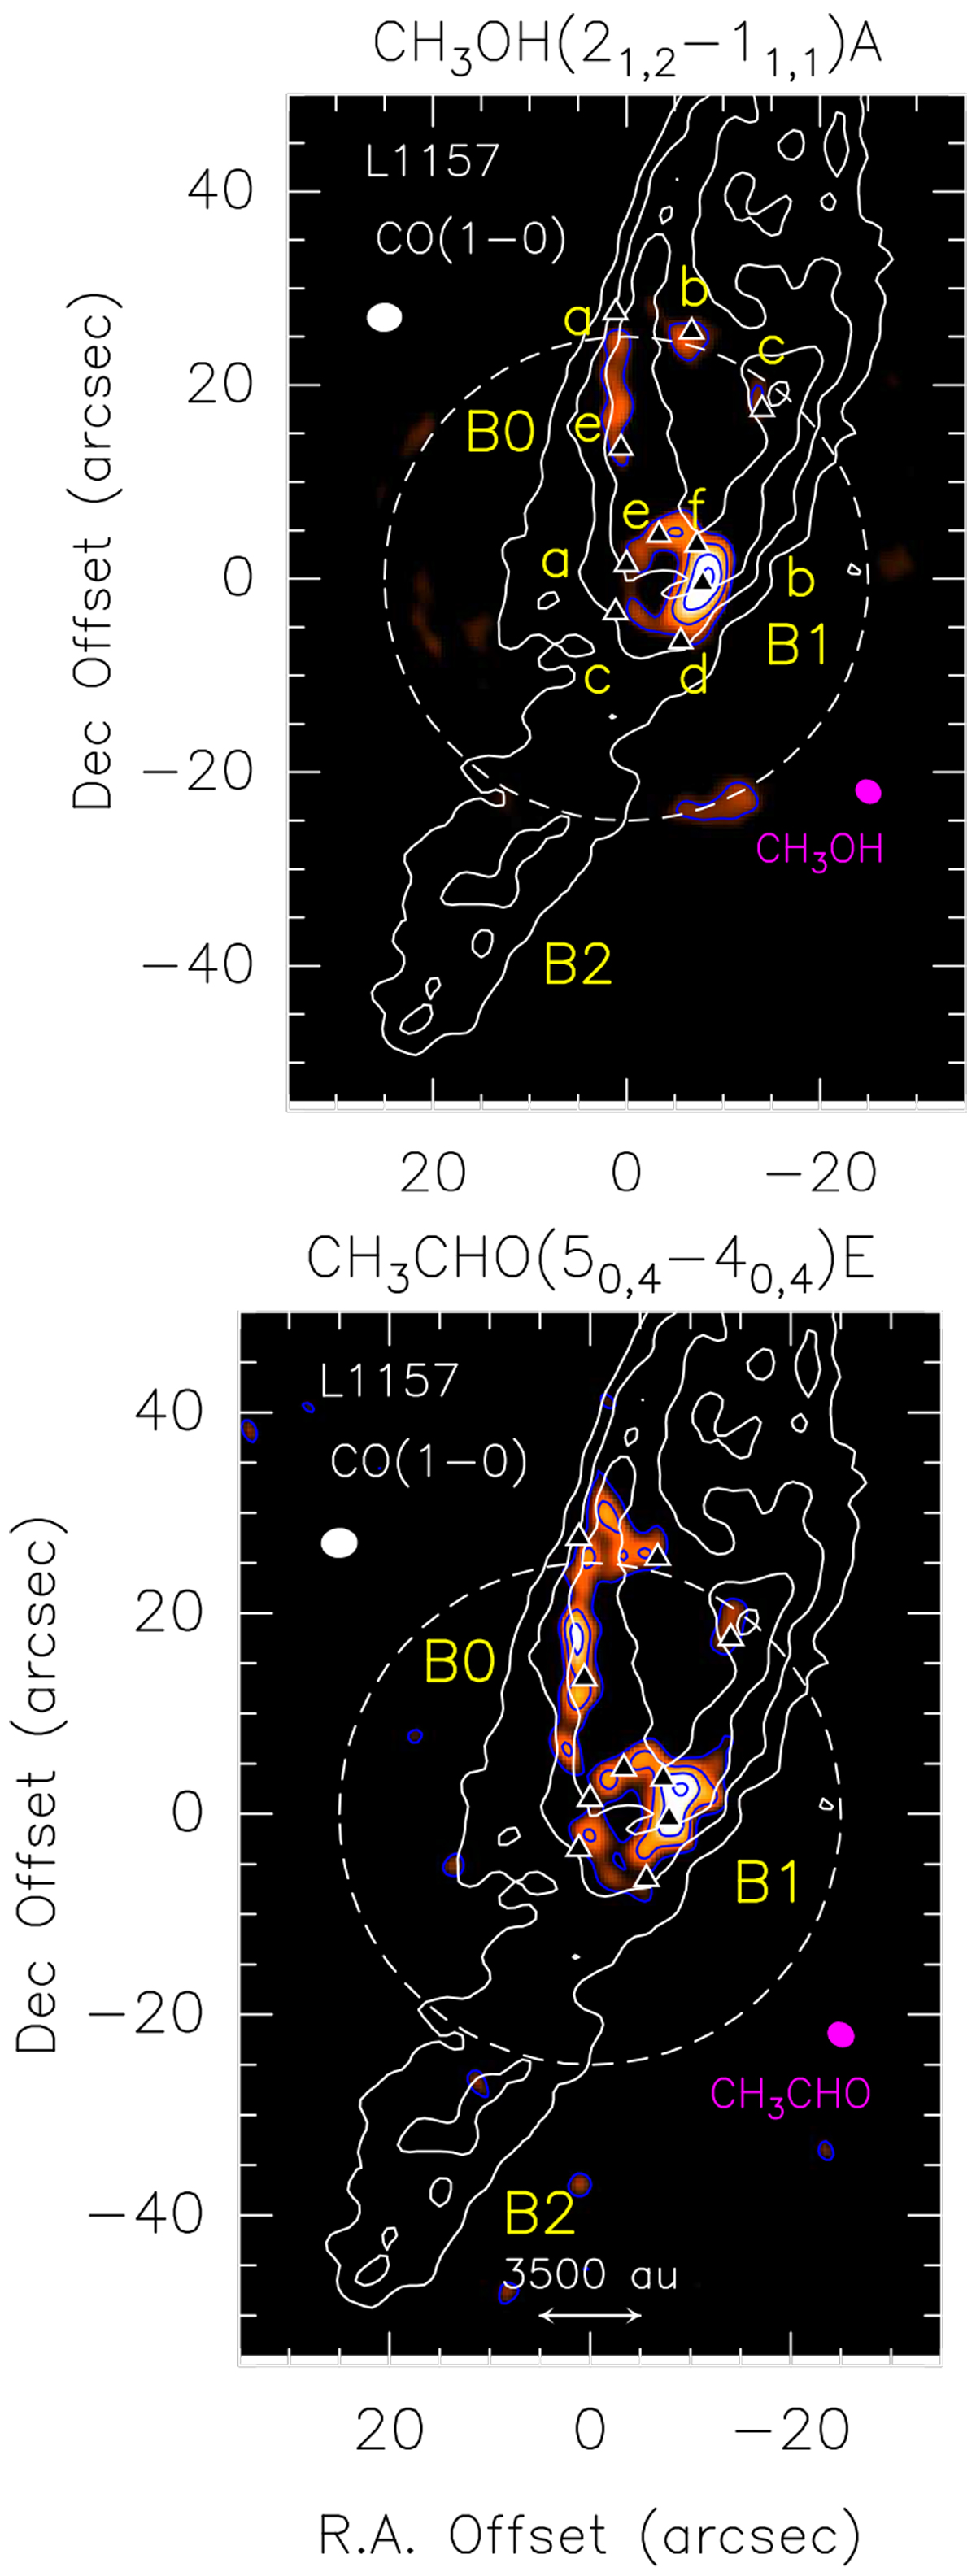
L1157 southern blueshifted lobe in CO (1–0) (white contours; Gueth et al. 1996). The precessing jet ejected by the central object L1157-mm (outside the frame and toward the northwest) excavated several clumpy cavities, named B0, B1, and B2, respectively. The maps are centred at α(J2000) = 20h39m10s.2, δ(J2000) = + 68°01′10′′.5 (Δα = +25′′ and Δδ = −63′′.5 from the L1157-mm protostar). Top panel: map (in colour scale) of the emission due to the CH3 OH(21,2–11,1) A transition (integrated over the whole velocity range). The first contour and step are 3σ (32 mJy beam−1 km s−1). For the CO image, the first contour and step are 6σ (1σ = 0.5 Jy beam−1 km s−1) and 4σ, respectively. The dashed circle shows the primary beam of the CH3OH image (64′′). Yellow labels are for the B0 and B1 clumps (black triangles) previously identified using molecular tracers (see text, and e.g. Benedettini et al. 2007; Codella et al. 2009, 2017). The white and magenta ellipses depict the synthesised beams of the CO (3′′.65×2′′.96, PA = +88°), and CH3 OH (2′′.97×2′′.26, PA = –155°) observations, respectively. Bottom panel: same as top panel but for CH3CHO (50,4 –40,4) E. The first contour and step are 3σ (7 mJy beam−1 km s−1). The synthesised beams of the CH3CHO image are similar to those of the CH3OH map.
Current usage metrics show cumulative count of Article Views (full-text article views including HTML views, PDF and ePub downloads, according to the available data) and Abstracts Views on Vision4Press platform.
Data correspond to usage on the plateform after 2015. The current usage metrics is available 48-96 hours after online publication and is updated daily on week days.
Initial download of the metrics may take a while.