Fig. 6
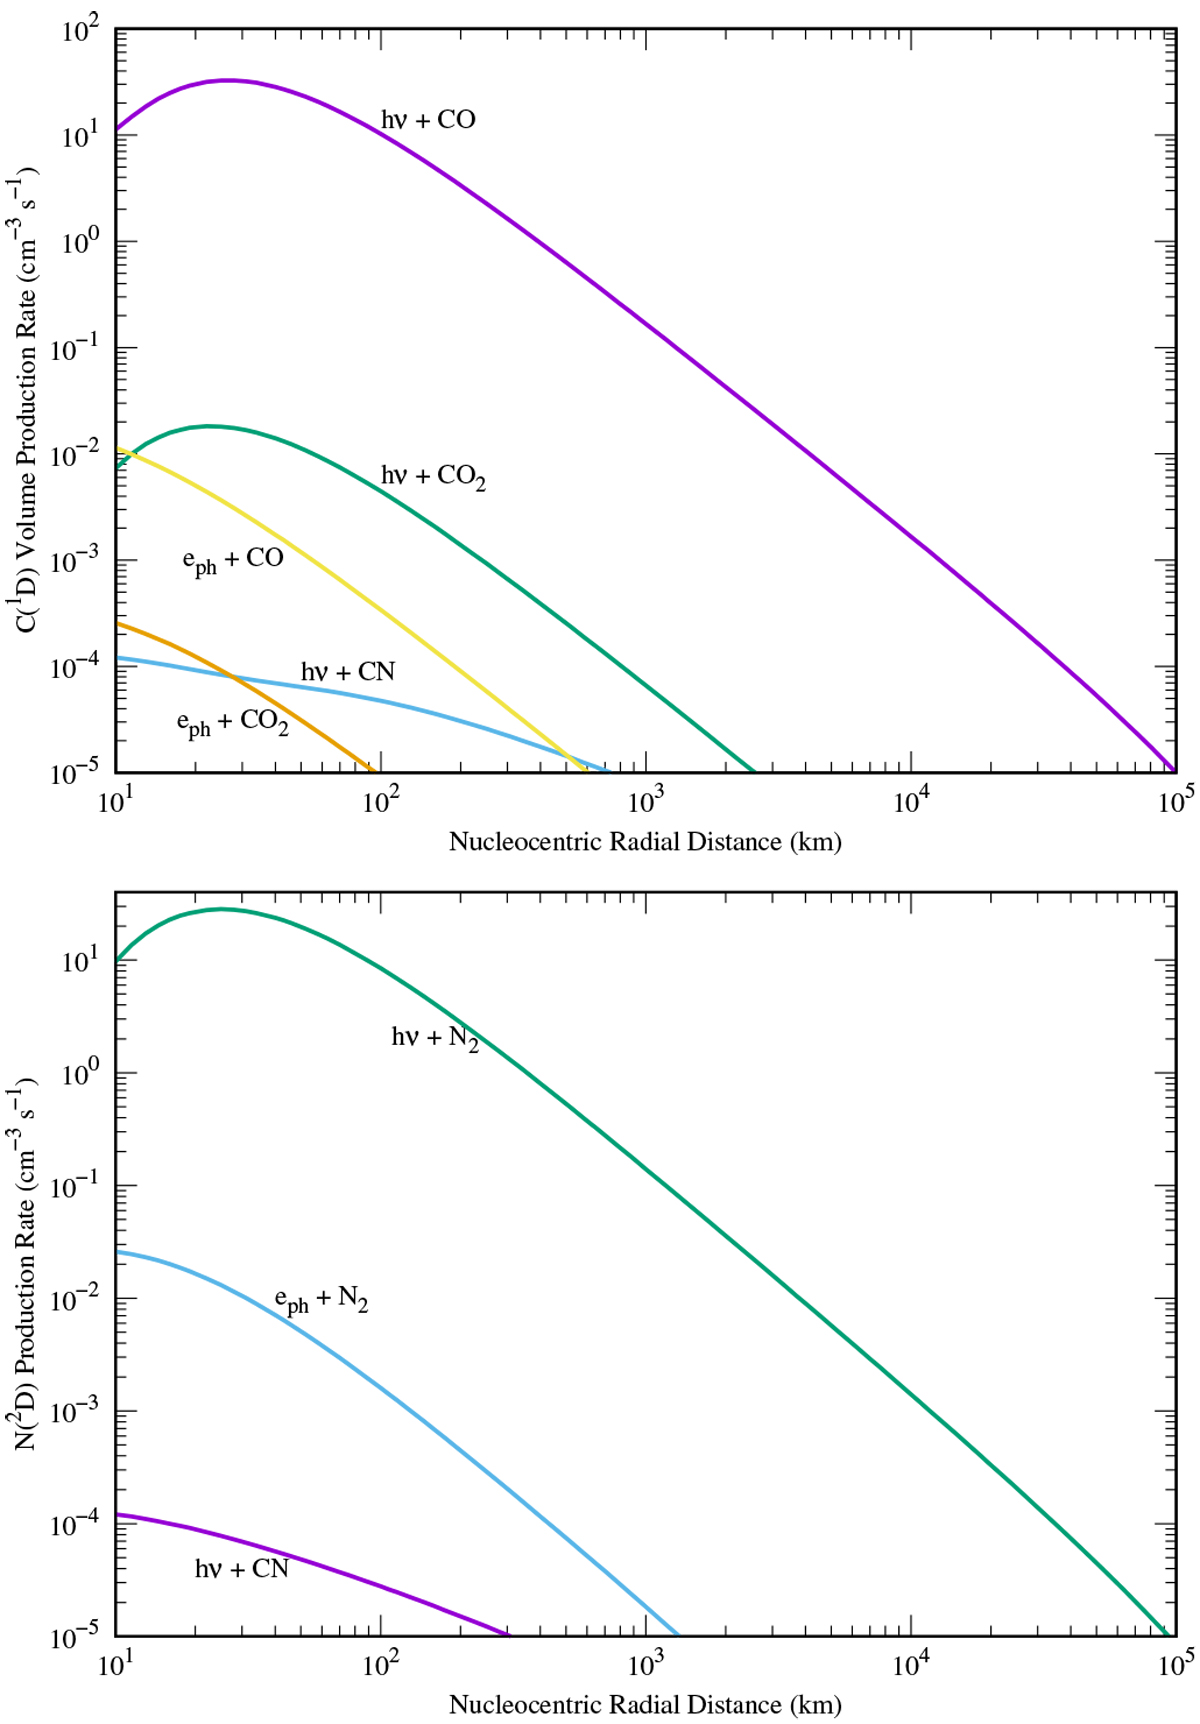
Calculated C(1D) (top panel) and N(2D) (bottom panel) production rate profiles, for different photon and electron impact dissociative excitation reactions of the major cometary volatiles, in C/2016 R2. Photodissociation and electron impact dissociation of CN producing N(2 D) production rate profiles are plotted after multiplying them by a factor of ten. The input conditions are the same as explained in Fig. 4. Here, hν represents a solar photon and eph is a suprathermal electron.
Current usage metrics show cumulative count of Article Views (full-text article views including HTML views, PDF and ePub downloads, according to the available data) and Abstracts Views on Vision4Press platform.
Data correspond to usage on the plateform after 2015. The current usage metrics is available 48-96 hours after online publication and is updated daily on week days.
Initial download of the metrics may take a while.