Fig. 11
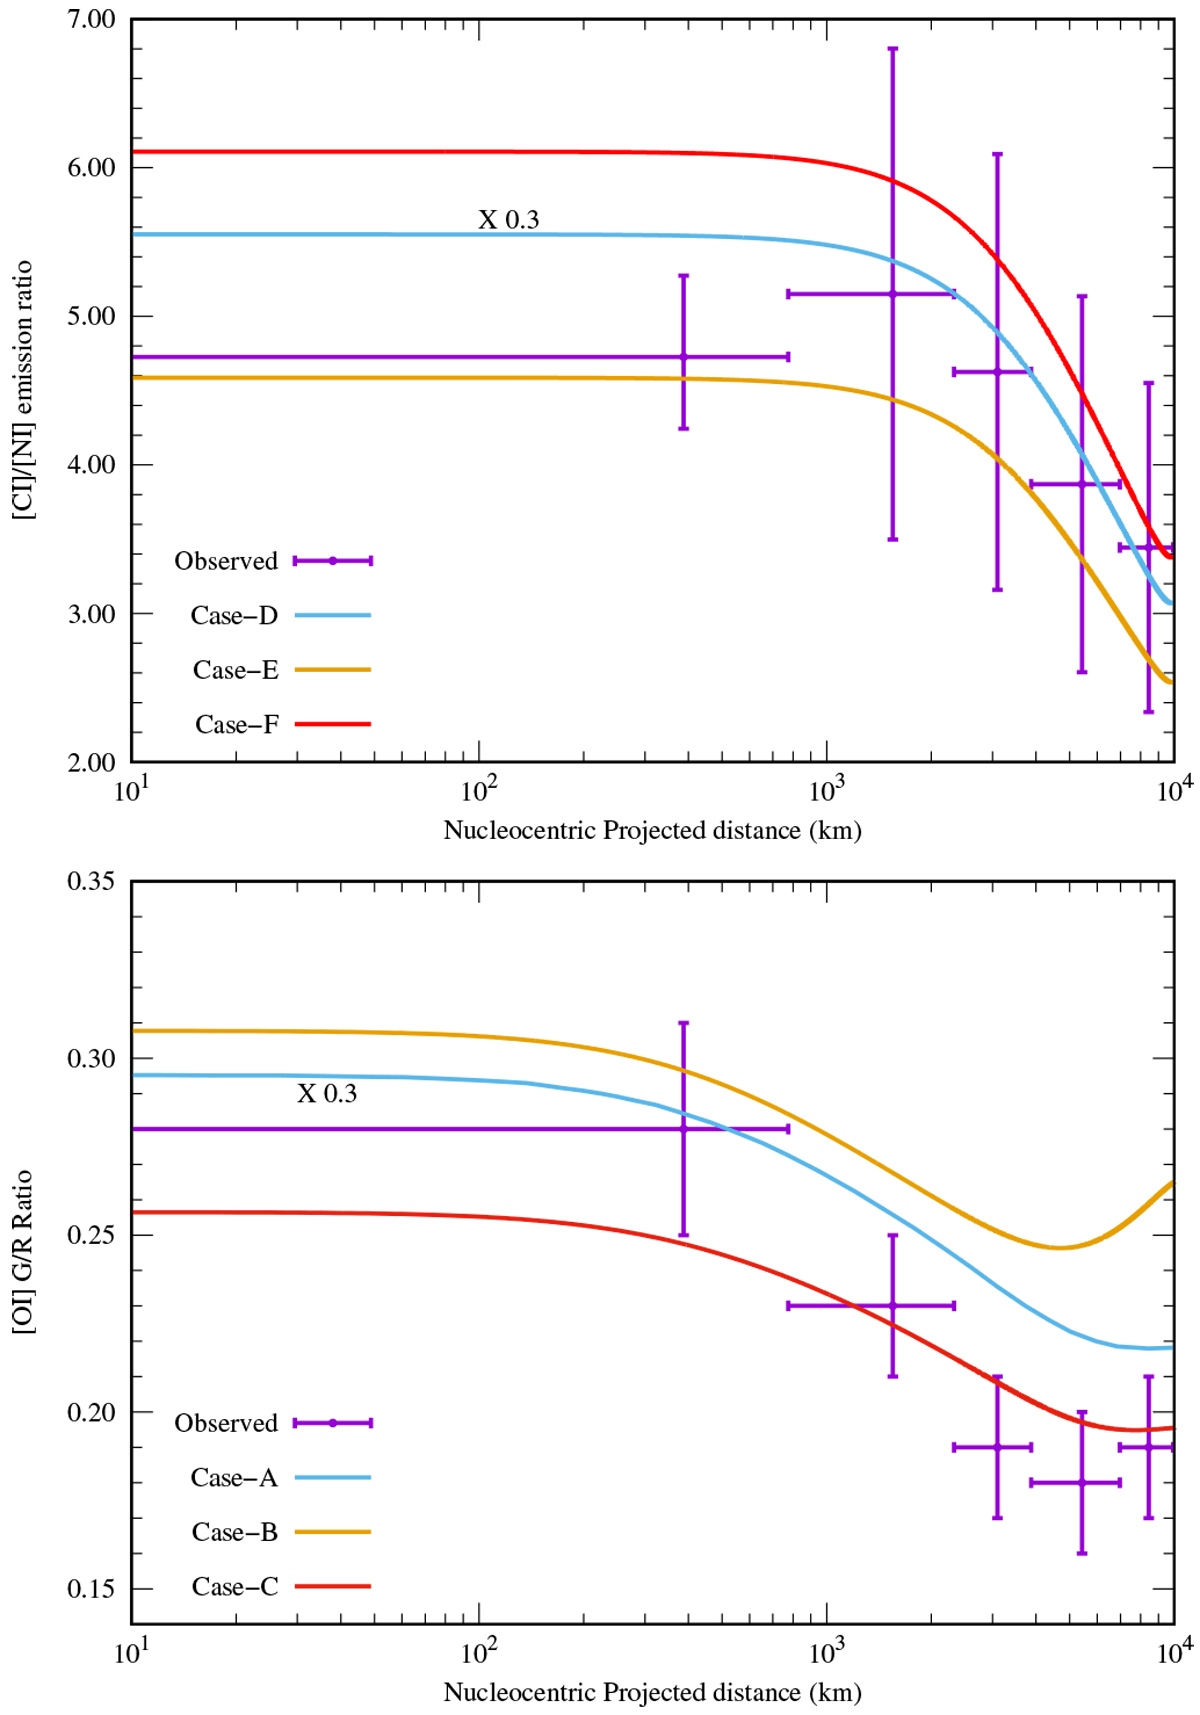
Comparison between modeled and observed [CI] to [NI] (top panel) and [OI] G/R (bottom panel) emission ratios in C/2016 R2. The calculated emission ratios for the input conditions are explained in Fig. 4. The calculated emission ratios for Case-A and Case-D are plotted after multiplication by a factor of 0.3. See the main text and Table 7 for more details about the conditions of Case-A to Case-F.
Current usage metrics show cumulative count of Article Views (full-text article views including HTML views, PDF and ePub downloads, according to the available data) and Abstracts Views on Vision4Press platform.
Data correspond to usage on the plateform after 2015. The current usage metrics is available 48-96 hours after online publication and is updated daily on week days.
Initial download of the metrics may take a while.