Fig. 1
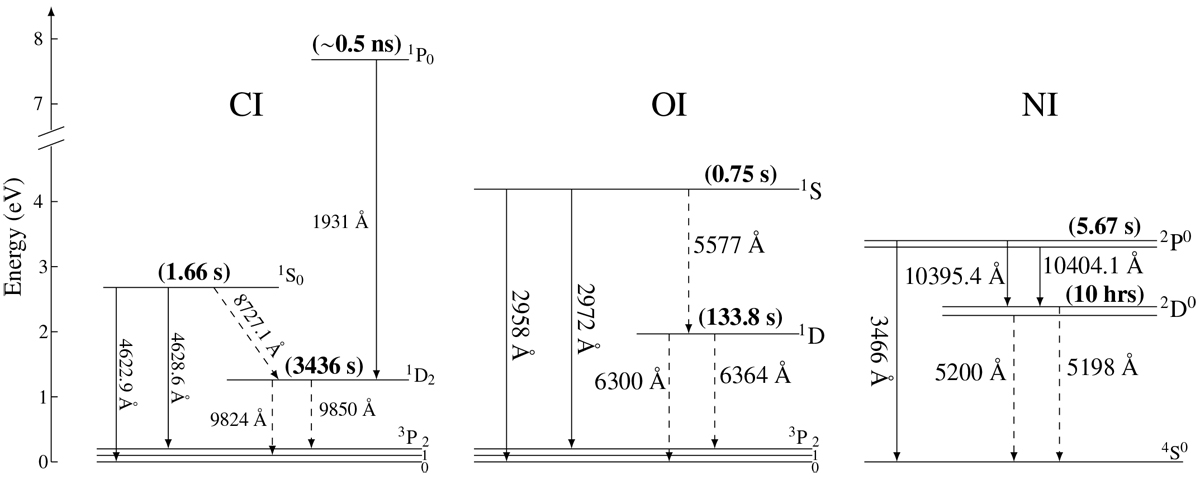
Partial Grotrian diagrams of atomic carbon (left), oxygen (centre), and nitrogen (right) showing various allowed and forbidden electronic transitions. The dashed lines represent the observed forbidden emission transitions in C/2016 R2. The values in parentheses represent the radiative lifetime of the excited state, which are taken from Wiese & Fuhr (2009) and Wiese et al. (1996).
Current usage metrics show cumulative count of Article Views (full-text article views including HTML views, PDF and ePub downloads, according to the available data) and Abstracts Views on Vision4Press platform.
Data correspond to usage on the plateform after 2015. The current usage metrics is available 48-96 hours after online publication and is updated daily on week days.
Initial download of the metrics may take a while.