Free Access
Fig. 3
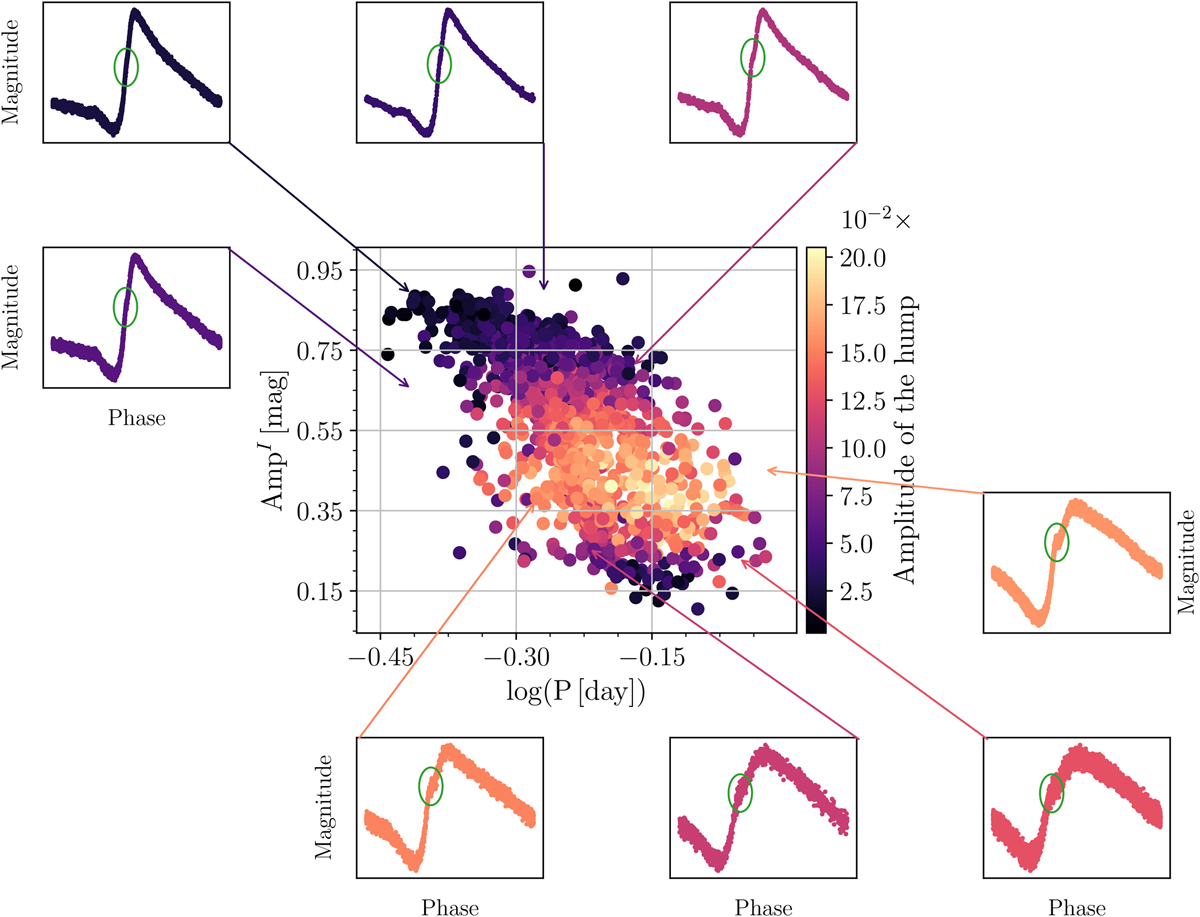
P–A diagram for our studied stars with color-coding based on the amplitude of the hump for the individual objects. The insets depict examples of phased light curves for a given region (gray grid) in the P–A diagram indicated by the arrows. The green ellipses approximately denote the location of the hump.
Current usage metrics show cumulative count of Article Views (full-text article views including HTML views, PDF and ePub downloads, according to the available data) and Abstracts Views on Vision4Press platform.
Data correspond to usage on the plateform after 2015. The current usage metrics is available 48-96 hours after online publication and is updated daily on week days.
Initial download of the metrics may take a while.