Fig. 2
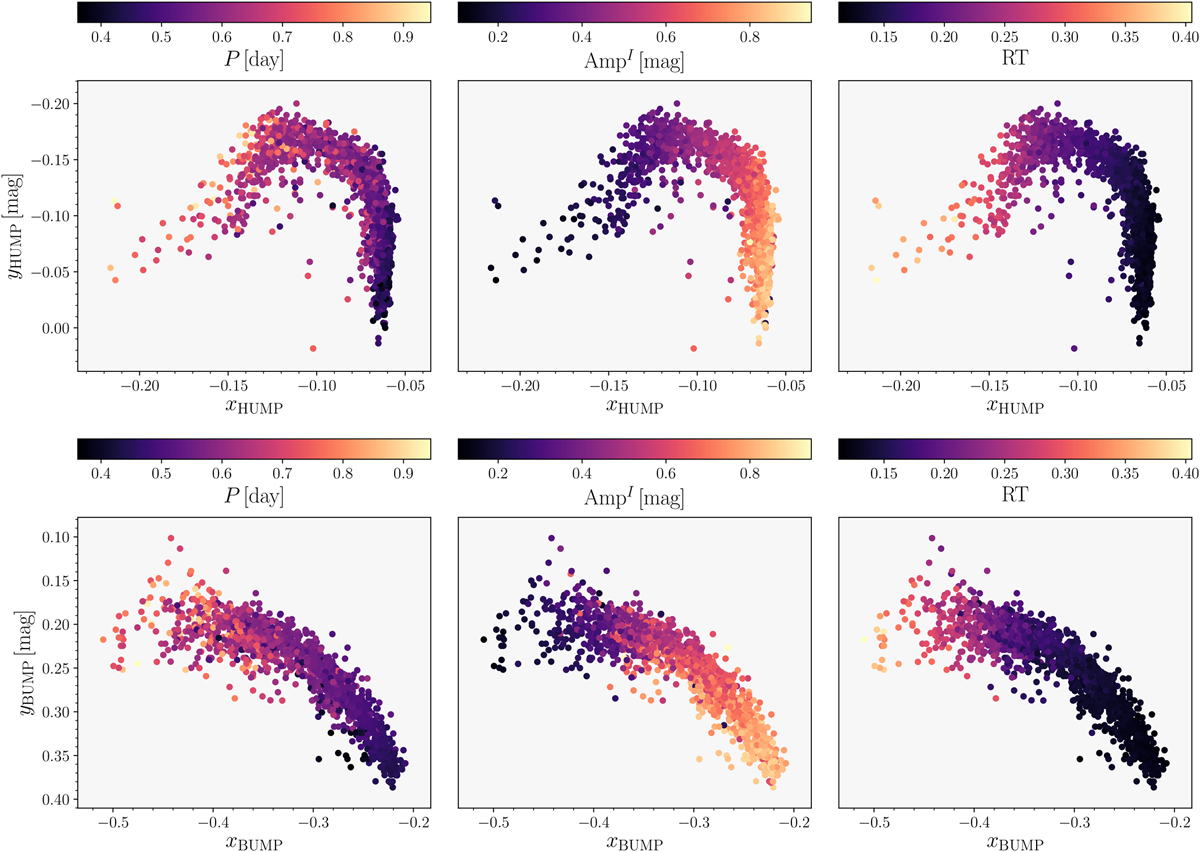
Relations between the coordinates of the centers for the main and early shock features in the phased light curves. Top panels: xHUMP vs. yHUMP. Bottom panels: same dependence but for the bump: xBUMP vs. yBUMP. The color-coding is based on the pulsation period (left-hand panels), total amplitude (middle panels), and RT (right-hand panels) of the individual stars.
Current usage metrics show cumulative count of Article Views (full-text article views including HTML views, PDF and ePub downloads, according to the available data) and Abstracts Views on Vision4Press platform.
Data correspond to usage on the plateform after 2015. The current usage metrics is available 48-96 hours after online publication and is updated daily on week days.
Initial download of the metrics may take a while.