Free Access
Fig. 10
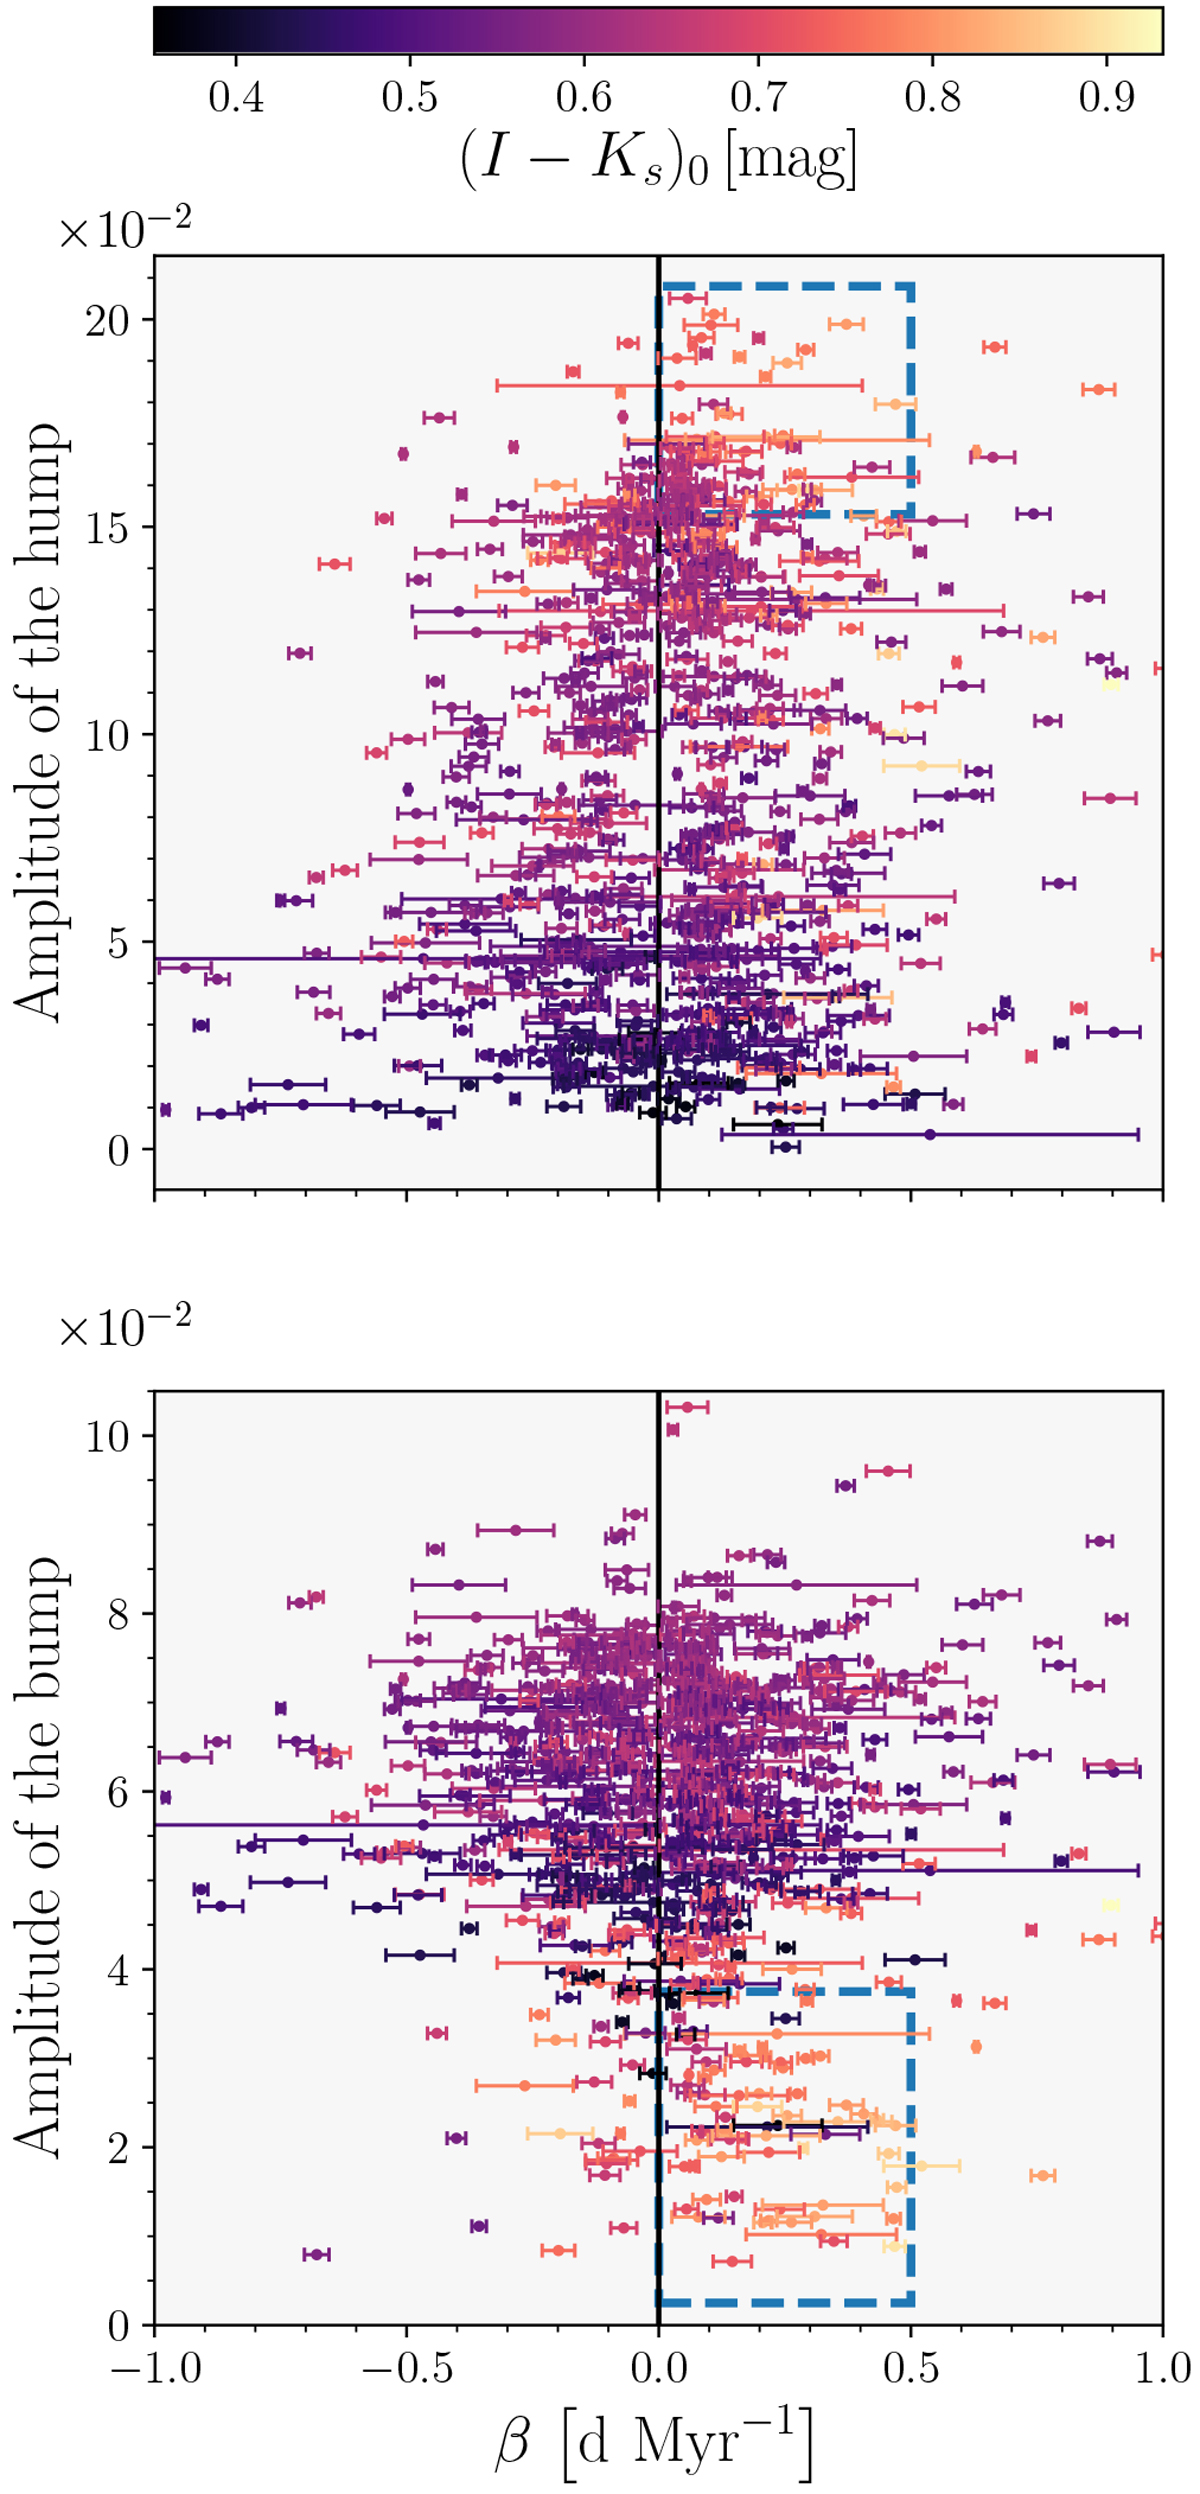
Period change rate β is shown as a function of the size of the amplitude of the hump (top panel) and bump (bottom panel). The color coding is based on the color
![]() . The two blue dashed rectangles in both panels mark the positions of two groups that lie close to the red edge of the IS.
. The two blue dashed rectangles in both panels mark the positions of two groups that lie close to the red edge of the IS.
Current usage metrics show cumulative count of Article Views (full-text article views including HTML views, PDF and ePub downloads, according to the available data) and Abstracts Views on Vision4Press platform.
Data correspond to usage on the plateform after 2015. The current usage metrics is available 48-96 hours after online publication and is updated daily on week days.
Initial download of the metrics may take a while.