Fig. 1
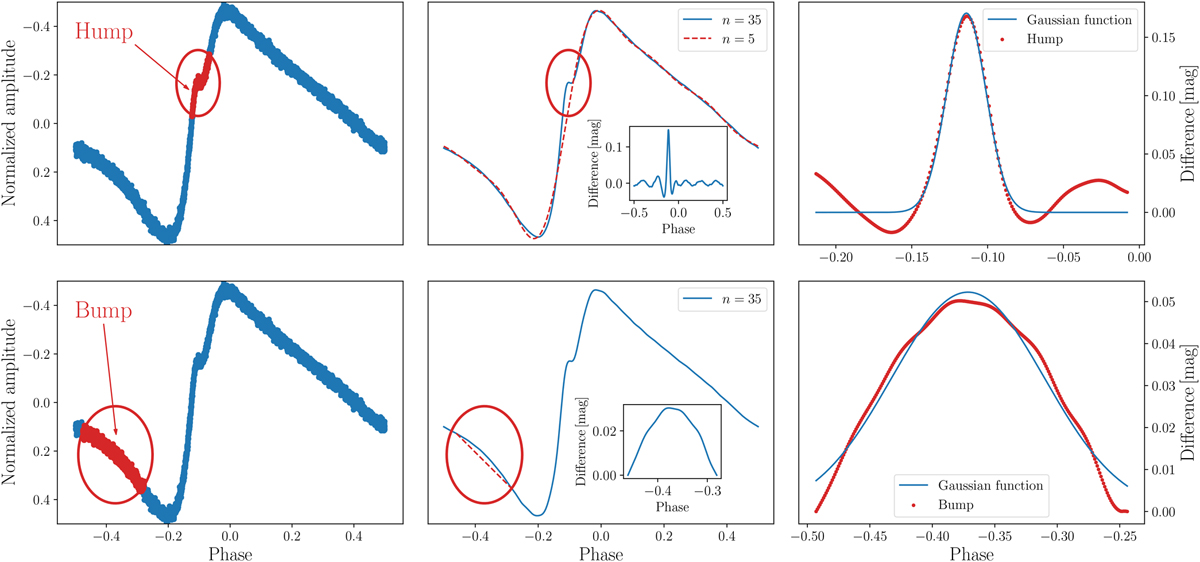
Visual description of the analysis of the hump (top panels) and bump (bottom panels) features in one of the sample stars. Left panels: phased light curve of a selected star with I-band photometric data represented with blue dots. The red ellipse denotes the shock features: hump (top left panel) and bump (bottom left panel). The red dots denote the removed portions of the phased light curve. Middle panels: model light curve described by a high-order Fourier (n = 35 in thelegend of the panels) fit as given by Eq. (1) (blue solid line). The dashed red line in the top middle panel represents a low-order Fourier fit (n = 5 in the legend of the panel) to the phased light curve with the hump region removed (i.e., the section of the light curve encompassed by the red ellipse), and the inset in the same panel shows the difference between the high- and low-order fits. Bottom middle panel: linear fit (red dashed line) for the area around the bump, and the inset shows the difference between thefit of a high-order Fourier series and the linear fit in the vicinity of the bump. Right-hand panels: result of subtracting the linear fits from the Fourier models (red dots), as fitted with a Gaussian (blue solid line).
Current usage metrics show cumulative count of Article Views (full-text article views including HTML views, PDF and ePub downloads, according to the available data) and Abstracts Views on Vision4Press platform.
Data correspond to usage on the plateform after 2015. The current usage metrics is available 48-96 hours after online publication and is updated daily on week days.
Initial download of the metrics may take a while.