Fig. 6.
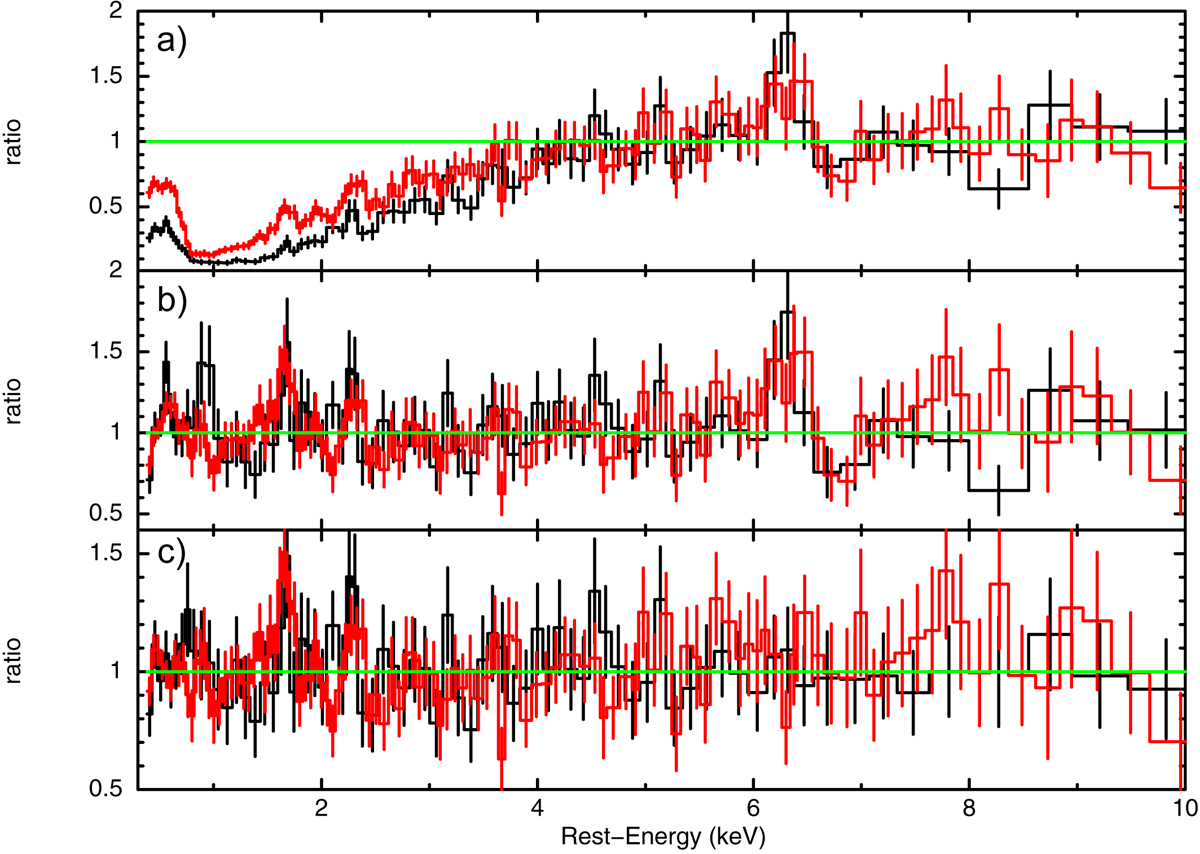
Panel a: XMM-Newton spectra with respect to a power-law only modelling in the 4–10 keV band. Panel b: low and high energy residuals still present after the WA was included in the modelling. Panel c: final data-to-model ratio after the inclusion of Gaussian components. A few unmodelled features still populate the energy range between 1.5 and 2.5 keV. However some of these may be directly attributed to the detector systematics.
Current usage metrics show cumulative count of Article Views (full-text article views including HTML views, PDF and ePub downloads, according to the available data) and Abstracts Views on Vision4Press platform.
Data correspond to usage on the plateform after 2015. The current usage metrics is available 48-96 hours after online publication and is updated daily on week days.
Initial download of the metrics may take a while.