Fig. 5.
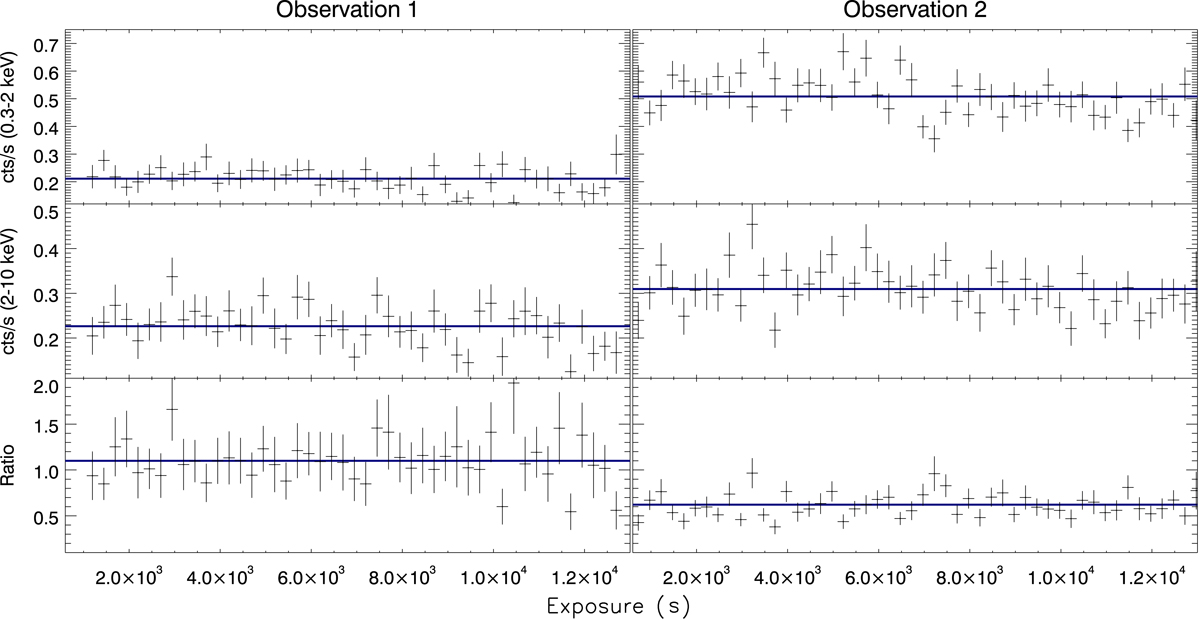
Soft (0.3–2 keV) and hard (2–10 keV) background subtracted XMM-Newton light curves and their ratios are displayed. The straight blue lines account for the average rates. Left side panel refers to Obs. 1, while right hand graphs account for Obs. 2. The adopted bin is 250 seconds and panels share the same scale. A very weak intra-observation variability is accompanied by remarkable flux variations between the pointings. In a similar fashion, hardness ratio are constant on kilosecond timescales, while the source shows two different spectral states between Obs. 1 and Obs. 2.
Current usage metrics show cumulative count of Article Views (full-text article views including HTML views, PDF and ePub downloads, according to the available data) and Abstracts Views on Vision4Press platform.
Data correspond to usage on the plateform after 2015. The current usage metrics is available 48-96 hours after online publication and is updated daily on week days.
Initial download of the metrics may take a while.