Fig. 8.
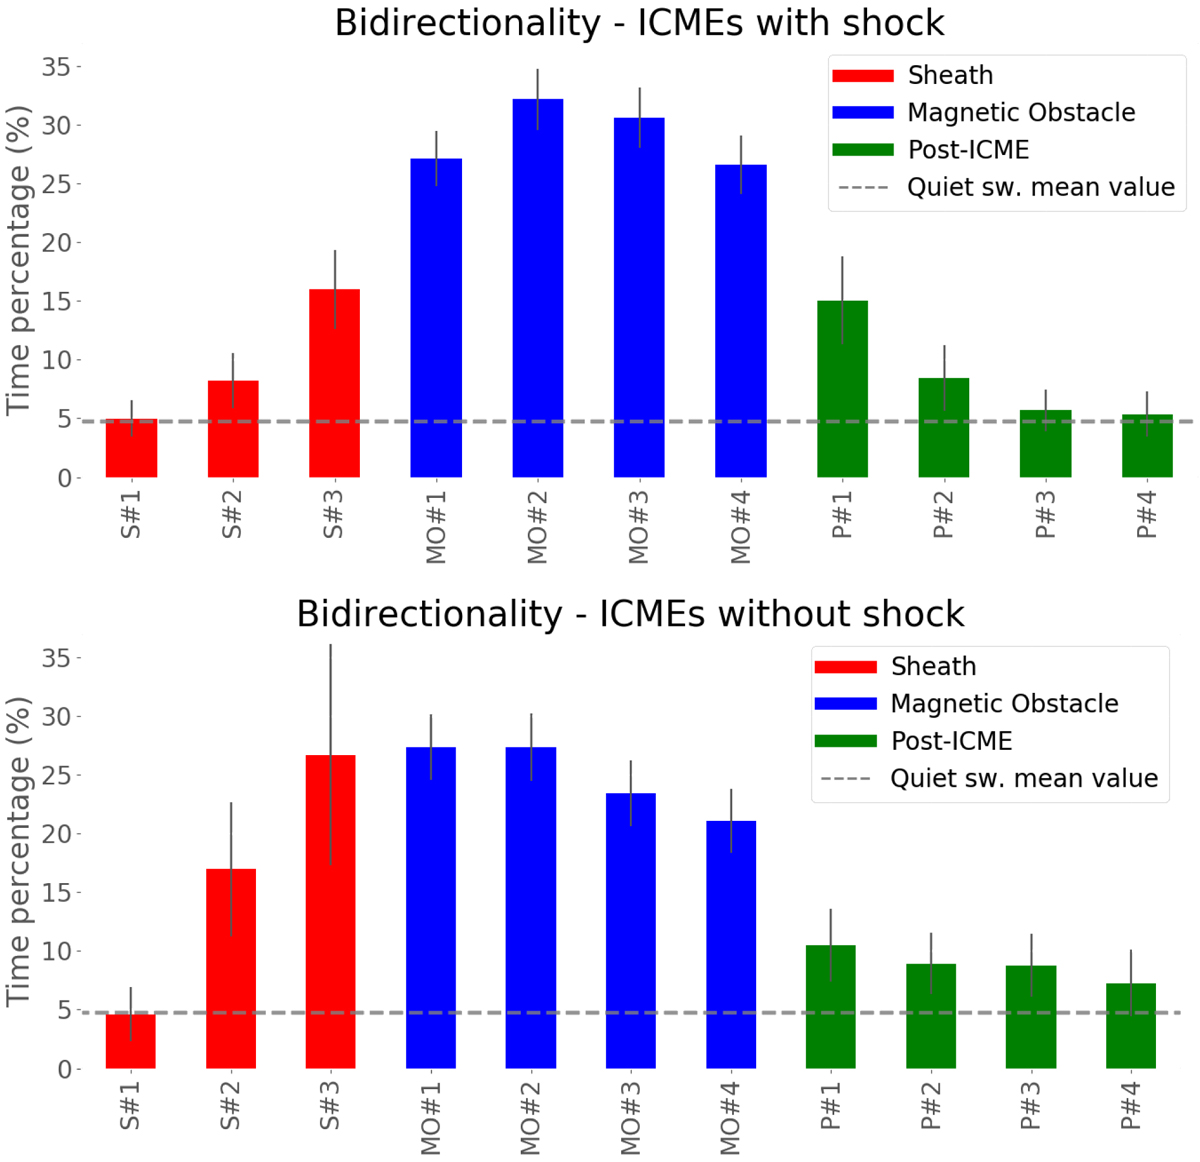
Histograms showing the mean value of the time-percentage of BDE for each sector during all the ICMEs transits catalogued in the ICME list, with shock at the beginning (top) and without (bottom). The colours show the different catalogued regions (see text for more details) and the labels correspond to equi-timed periods of the transit of those regions (S – sheath, MO – magnetic obstacle, P – post-ICME). The error bars indicate the standard error of the mean.
Current usage metrics show cumulative count of Article Views (full-text article views including HTML views, PDF and ePub downloads, according to the available data) and Abstracts Views on Vision4Press platform.
Data correspond to usage on the plateform after 2015. The current usage metrics is available 48-96 hours after online publication and is updated daily on week days.
Initial download of the metrics may take a while.