Free Access
Fig. 5.
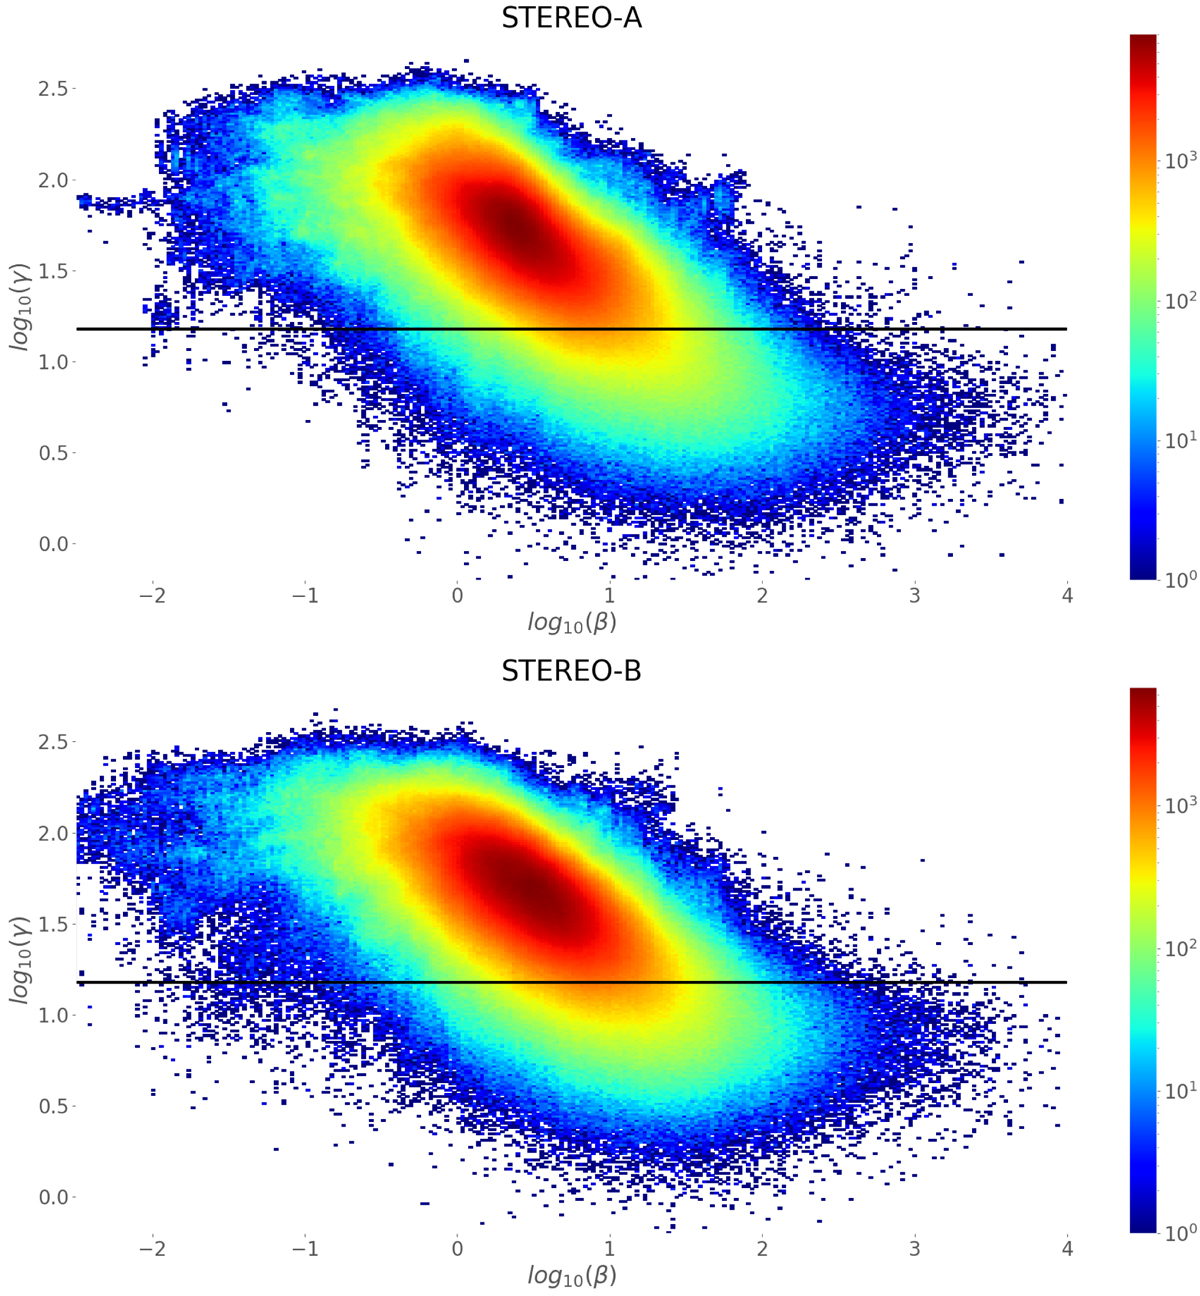
Two-dimensional histograms showing the relation between the ripple (γ) and the log10 of the plasma β for the entire period under study (2007–2014) for STEREO-A (top) and STEREO-B (bottom). The horizontal black line shows γth, and the colour bar indicates the number of events for each bin in logarithmic scale.
Current usage metrics show cumulative count of Article Views (full-text article views including HTML views, PDF and ePub downloads, according to the available data) and Abstracts Views on Vision4Press platform.
Data correspond to usage on the plateform after 2015. The current usage metrics is available 48-96 hours after online publication and is updated daily on week days.
Initial download of the metrics may take a while.