Free Access
Fig. 8.
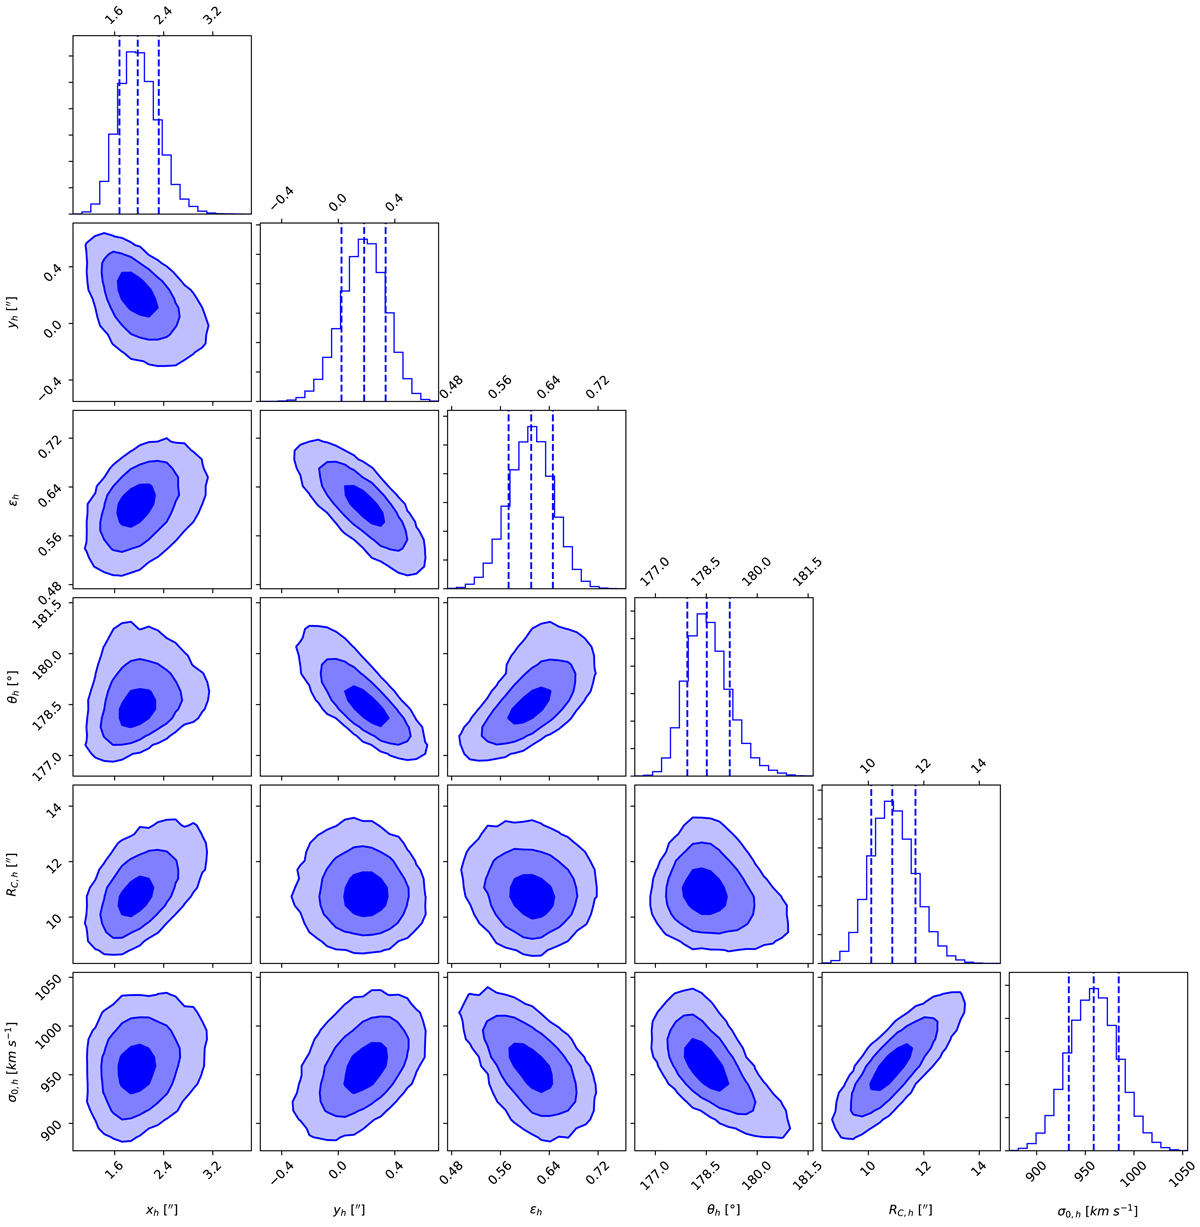
Posterior distributions of the parameter values of the cluster-scale mass component. Blue contours correspond to the 1, 2, and 3σ confidence levels of a Gaussian distribution, while vertical blue dashed lines in the histograms are the 16th, 50th, and 84th percentiles.
Current usage metrics show cumulative count of Article Views (full-text article views including HTML views, PDF and ePub downloads, according to the available data) and Abstracts Views on Vision4Press platform.
Data correspond to usage on the plateform after 2015. The current usage metrics is available 48-96 hours after online publication and is updated daily on week days.
Initial download of the metrics may take a while.