Free Access
Fig. 7.
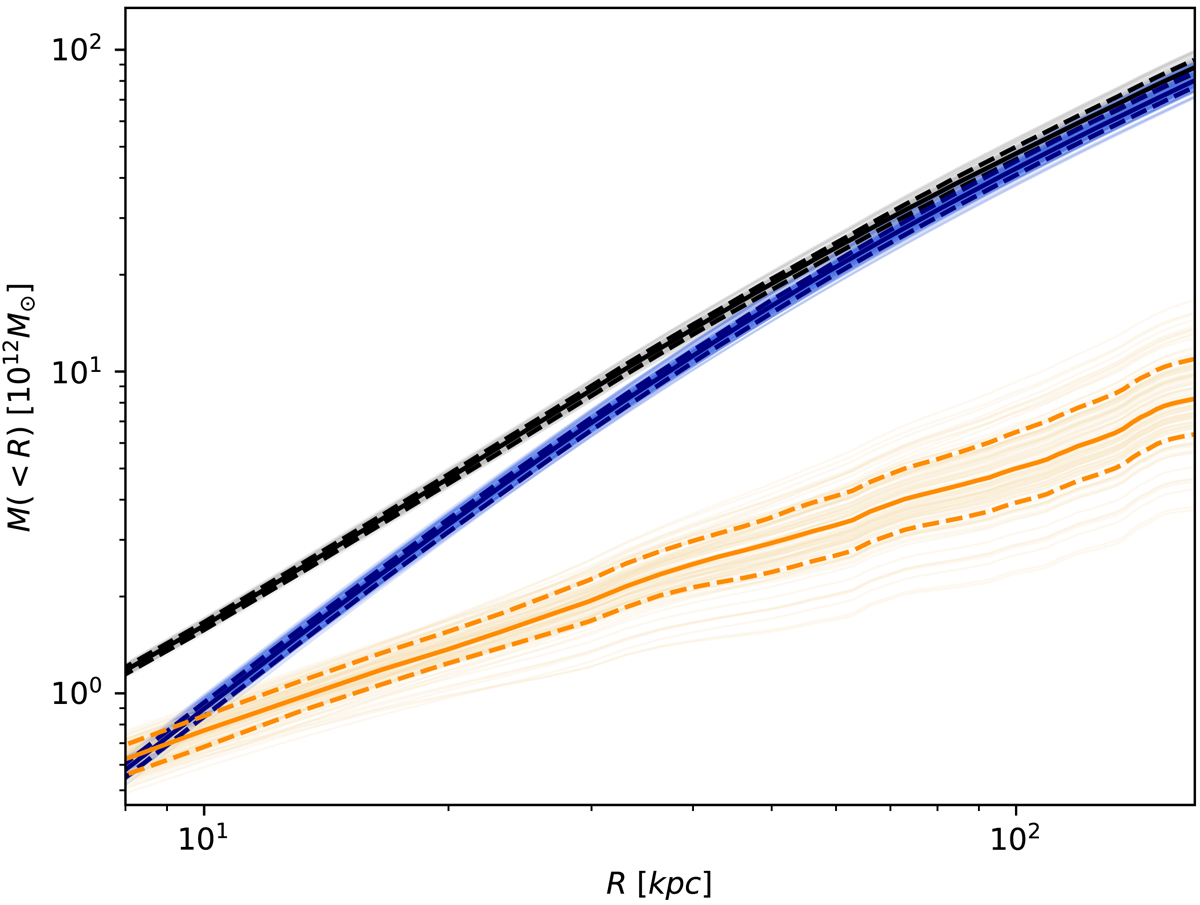
Cumulative projected mass profiles from our fiducial model; black, blue, and orange curves represent the total, the smooth, and the clumpy components, respectively. Solid and dashed lines trace the median and 16th–84th percentiles, while the light ones complete the sub-sample extracted from the final MCMC chains.
Current usage metrics show cumulative count of Article Views (full-text article views including HTML views, PDF and ePub downloads, according to the available data) and Abstracts Views on Vision4Press platform.
Data correspond to usage on the plateform after 2015. The current usage metrics is available 48-96 hours after online publication and is updated daily on week days.
Initial download of the metrics may take a while.