Fig. 2.
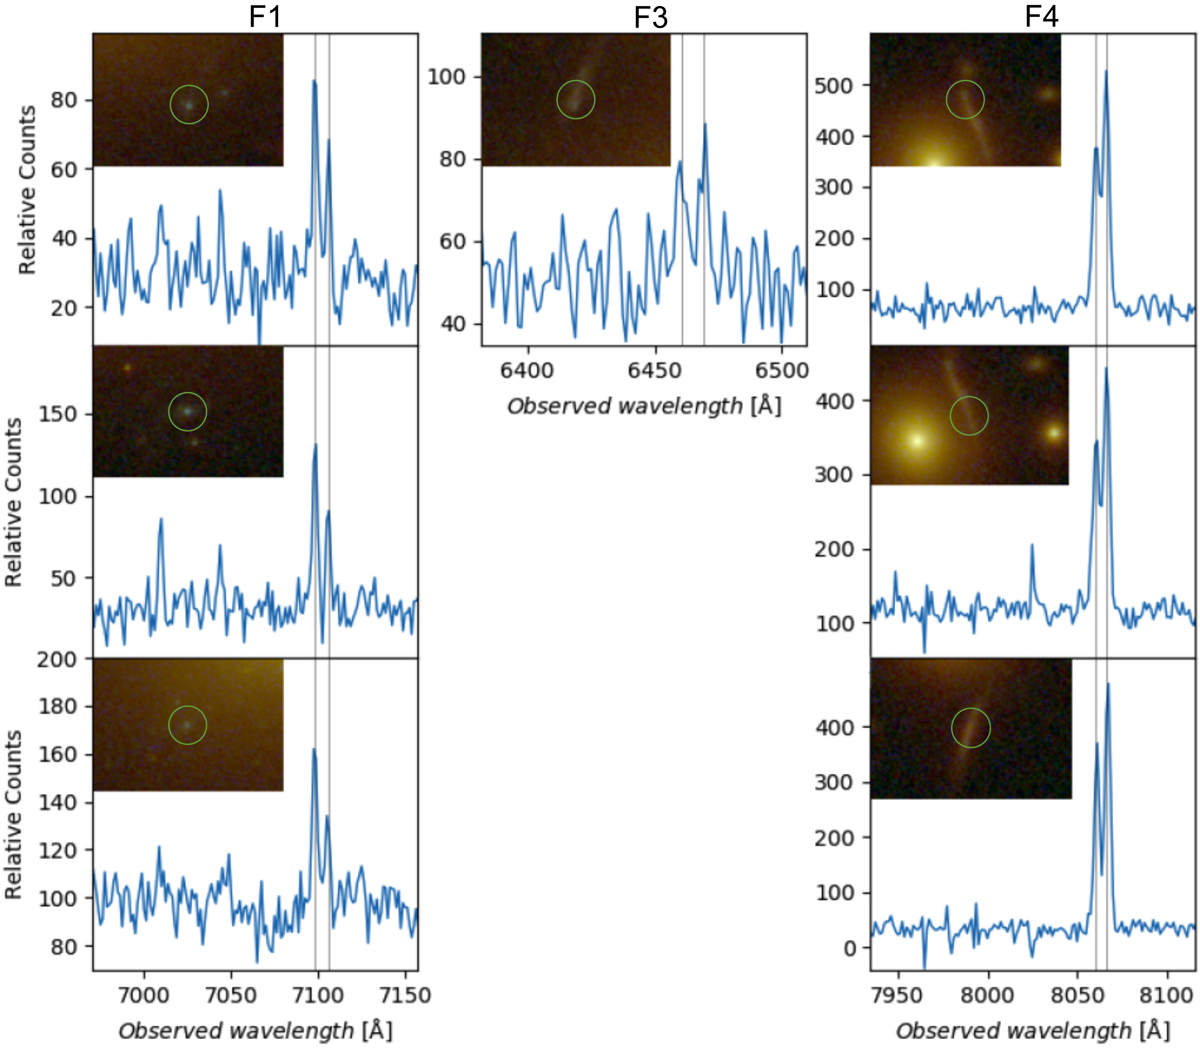
HST image cutouts with the circular aperture (green circle) we use to extract the image spectra and the relevant spectral details for some multiple images in the A2163 core. The panels of each column refer to the same family and (from the top to the bottom) to the images a, b, and c, respectively. In Table 2, QFs for all multiple images are reported. The spectral line doublets (in gray) are [C III] for the first two columns and [O II] for the last one.
Current usage metrics show cumulative count of Article Views (full-text article views including HTML views, PDF and ePub downloads, according to the available data) and Abstracts Views on Vision4Press platform.
Data correspond to usage on the plateform after 2015. The current usage metrics is available 48-96 hours after online publication and is updated daily on week days.
Initial download of the metrics may take a while.