Fig. 6.
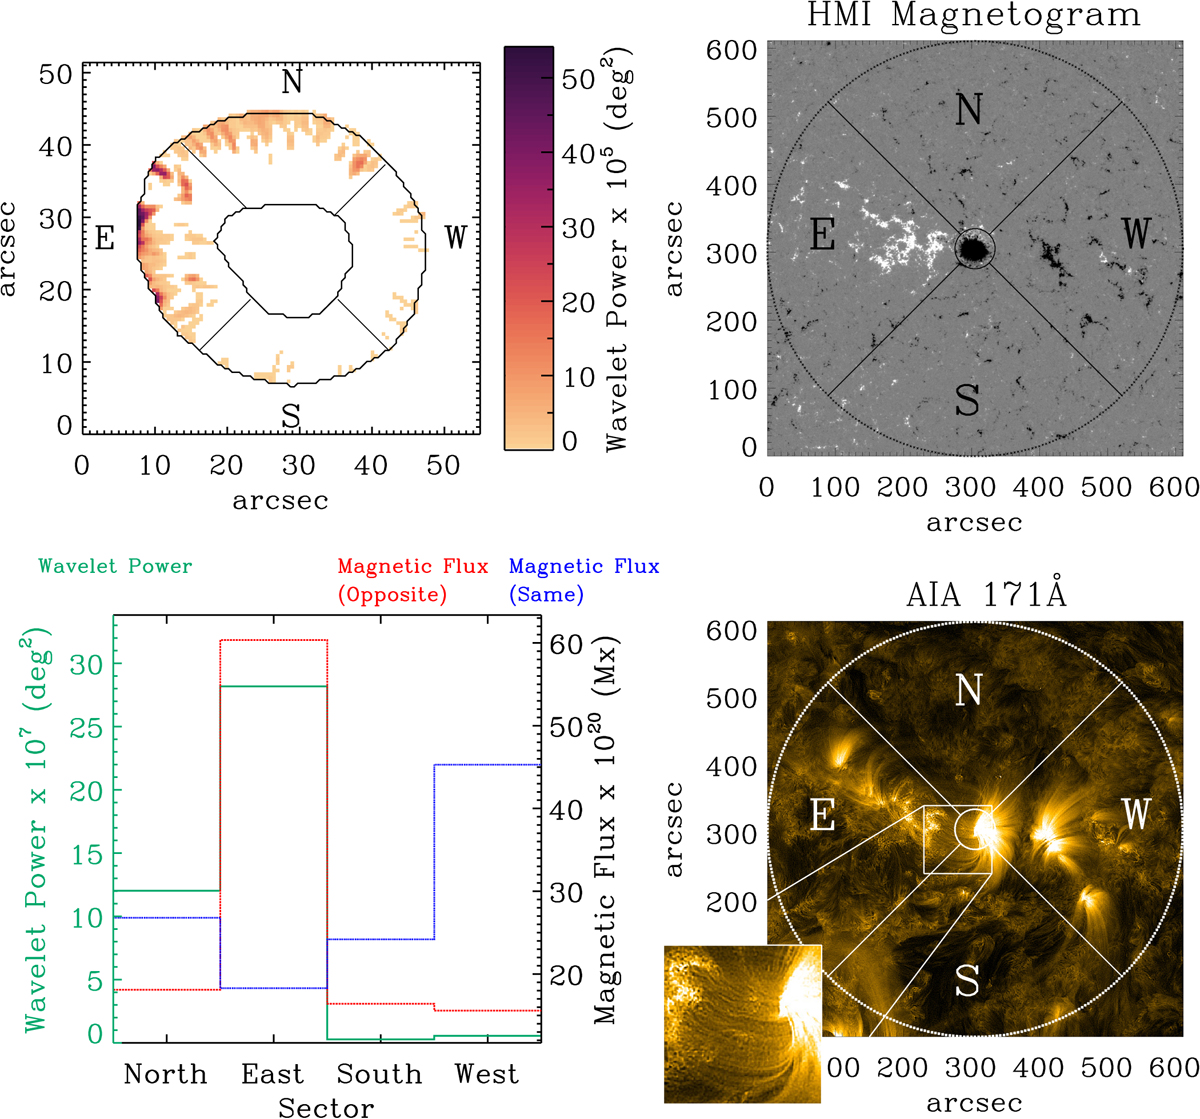
Penumbral distribution of the wavelet power of NOAA AR12218 and its comparison to the spatial distribution of the magnetic field and coronal emission. Upper left panel: spatial distribution of events, where the penumbra is divided into four 90° sectors (north, east, south, and west). Upper and lower right panels: HMI line-of-sight magnetogram (saturated between −200 and 200 gauss) and corresponding coronal image in the AIA 171 Å filter (with the area denoted with a white square zoomed in the lower left corner of the image). Both display an extended field of view at the time the sunspot was crossing the central meridian. Lower left panel: histogram of the integrated azimuthal distribution of magnetic fluxes and wavelet power. The black and red lines show the magnetic flux around the target sunspot of the same and opposite polarity, respectively, and the blue line corresponds to the wavelet power of the studied sunspot.
Current usage metrics show cumulative count of Article Views (full-text article views including HTML views, PDF and ePub downloads, according to the available data) and Abstracts Views on Vision4Press platform.
Data correspond to usage on the plateform after 2015. The current usage metrics is available 48-96 hours after online publication and is updated daily on week days.
Initial download of the metrics may take a while.