Fig. 2.
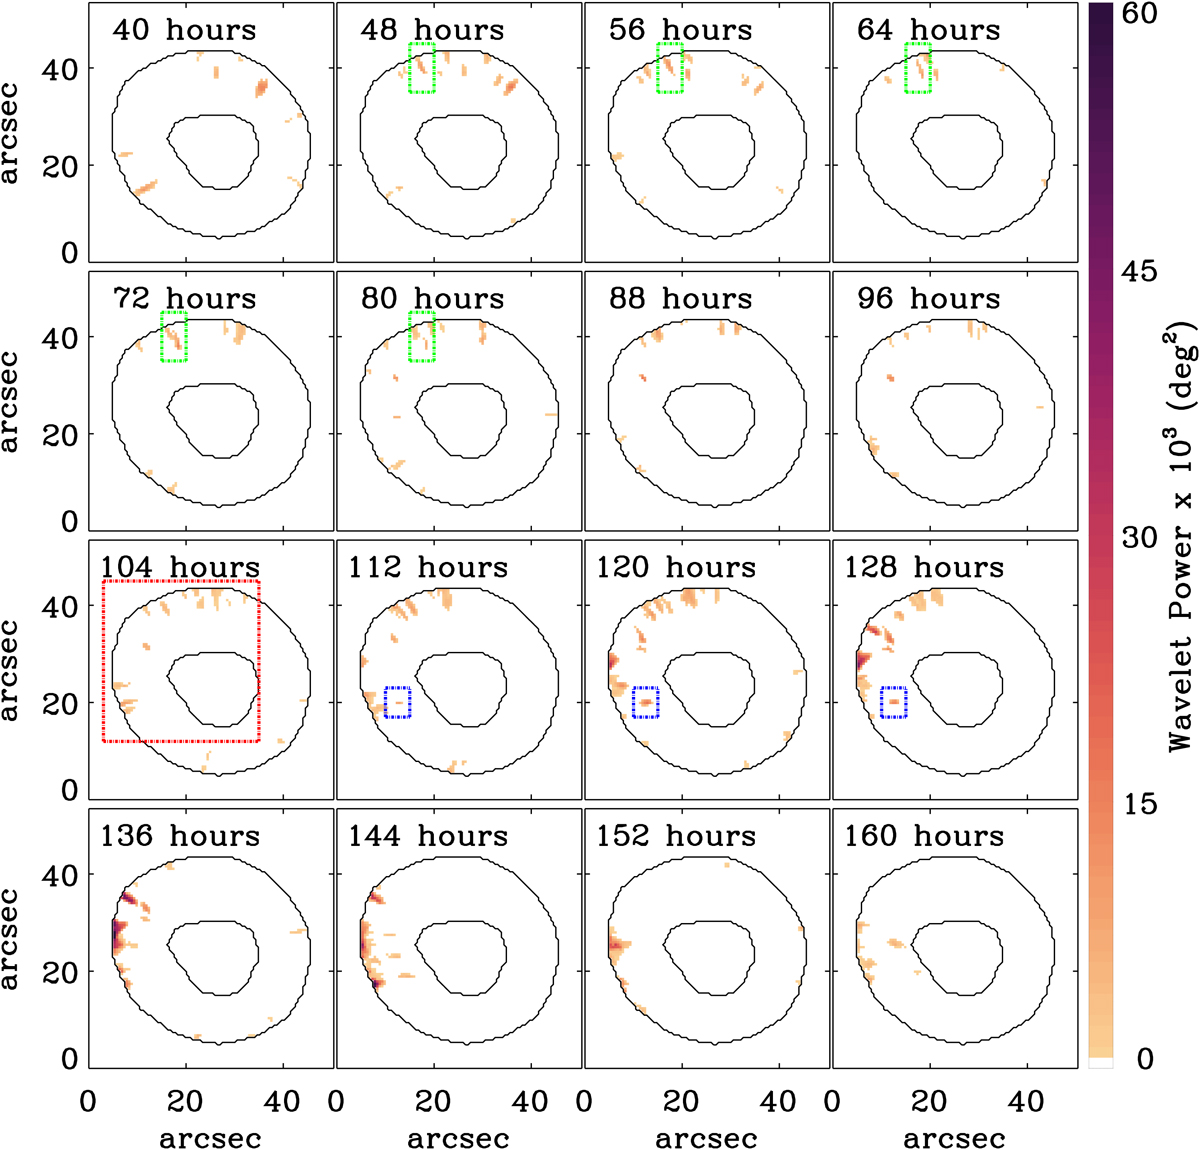
Catalogue of events of the same isolated sunspot in NOAA AR12218 that fulfil the conditions applied for each penumbral pixel. Each panel represents a time step (the time from the beginning of the sequence, in hours, is written in each panel) of the full time sequence. The contours highlight the boundary of the penumbra of the sunspot and the colour scale indicates the wavelet power values of each pixel that meets the imposed selection criteria. The first and last time step are denoted in Fig. 3 with vertical dashed purple lines. The coloured boxes highlight areas of interest as mentioned in the text.
Current usage metrics show cumulative count of Article Views (full-text article views including HTML views, PDF and ePub downloads, according to the available data) and Abstracts Views on Vision4Press platform.
Data correspond to usage on the plateform after 2015. The current usage metrics is available 48-96 hours after online publication and is updated daily on week days.
Initial download of the metrics may take a while.