Fig. 1.
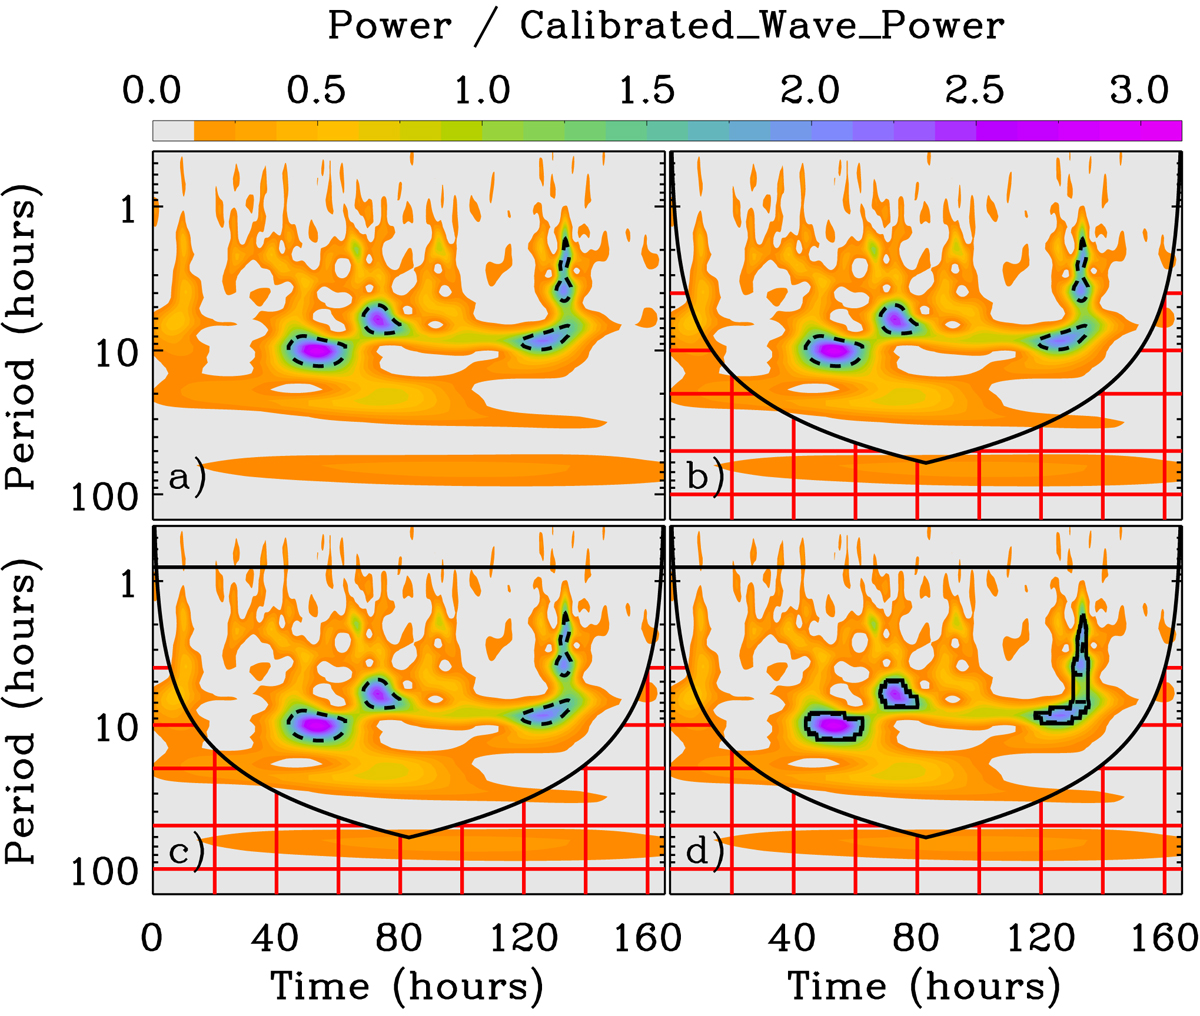
Wavelet decomposition of the time series for one pixel. The background is the same for the four panels and the colour scale is the wavelet power normalised by the calibrated wavelet power (five times the estimated noise level of the magnetic field inclination). The x-axis corresponds to the time sequence and the y-axis is the period. The horizontal line, dashed line, solid contours, and red gridded area reflect the different criteria for the event selection explained in Sect. 2.
Current usage metrics show cumulative count of Article Views (full-text article views including HTML views, PDF and ePub downloads, according to the available data) and Abstracts Views on Vision4Press platform.
Data correspond to usage on the plateform after 2015. The current usage metrics is available 48-96 hours after online publication and is updated daily on week days.
Initial download of the metrics may take a while.