Free Access
Fig. 8.
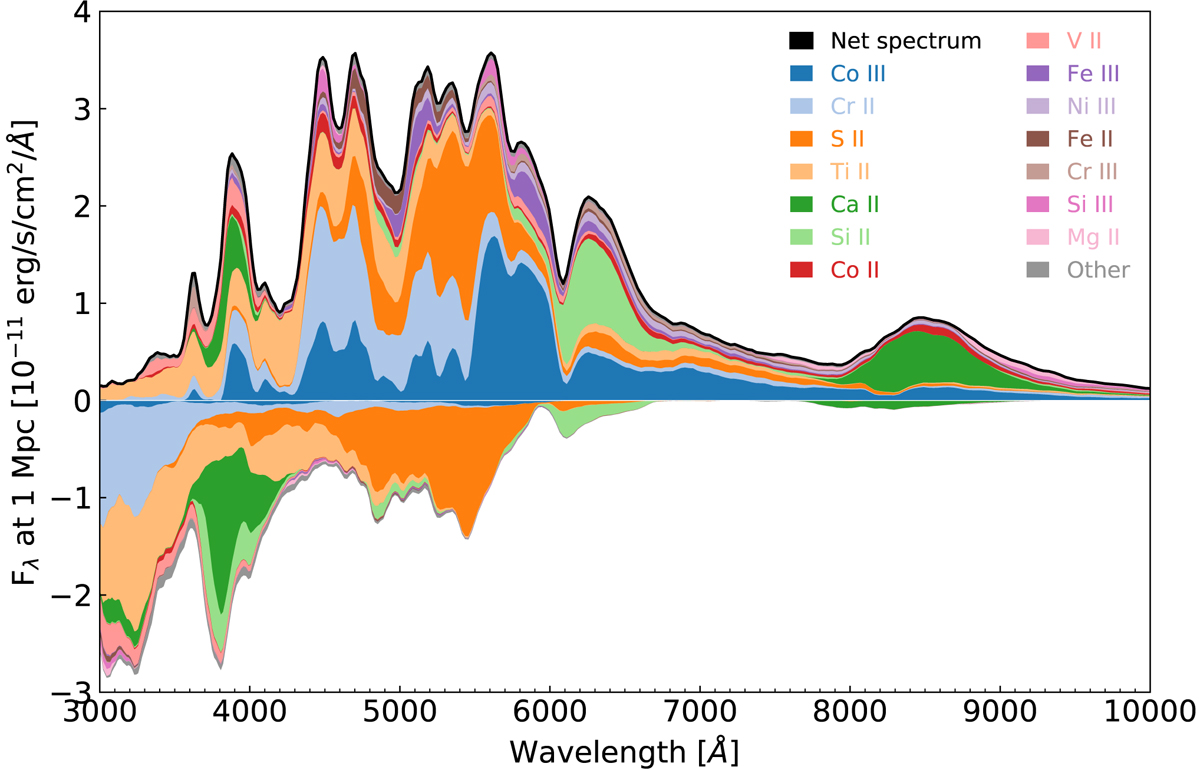
Angle averaged emission and absorption spectrum for Model M2a at 18 days after explosion. The total emission spectrum is plotted in black. The color coding indicates the ions responsible for the emission and absorption. The ions are listed in the legend of this figure in order of greatest contribution of flux.
Current usage metrics show cumulative count of Article Views (full-text article views including HTML views, PDF and ePub downloads, according to the available data) and Abstracts Views on Vision4Press platform.
Data correspond to usage on the plateform after 2015. The current usage metrics is available 48-96 hours after online publication and is updated daily on week days.
Initial download of the metrics may take a while.