Free Access
Fig. 4.
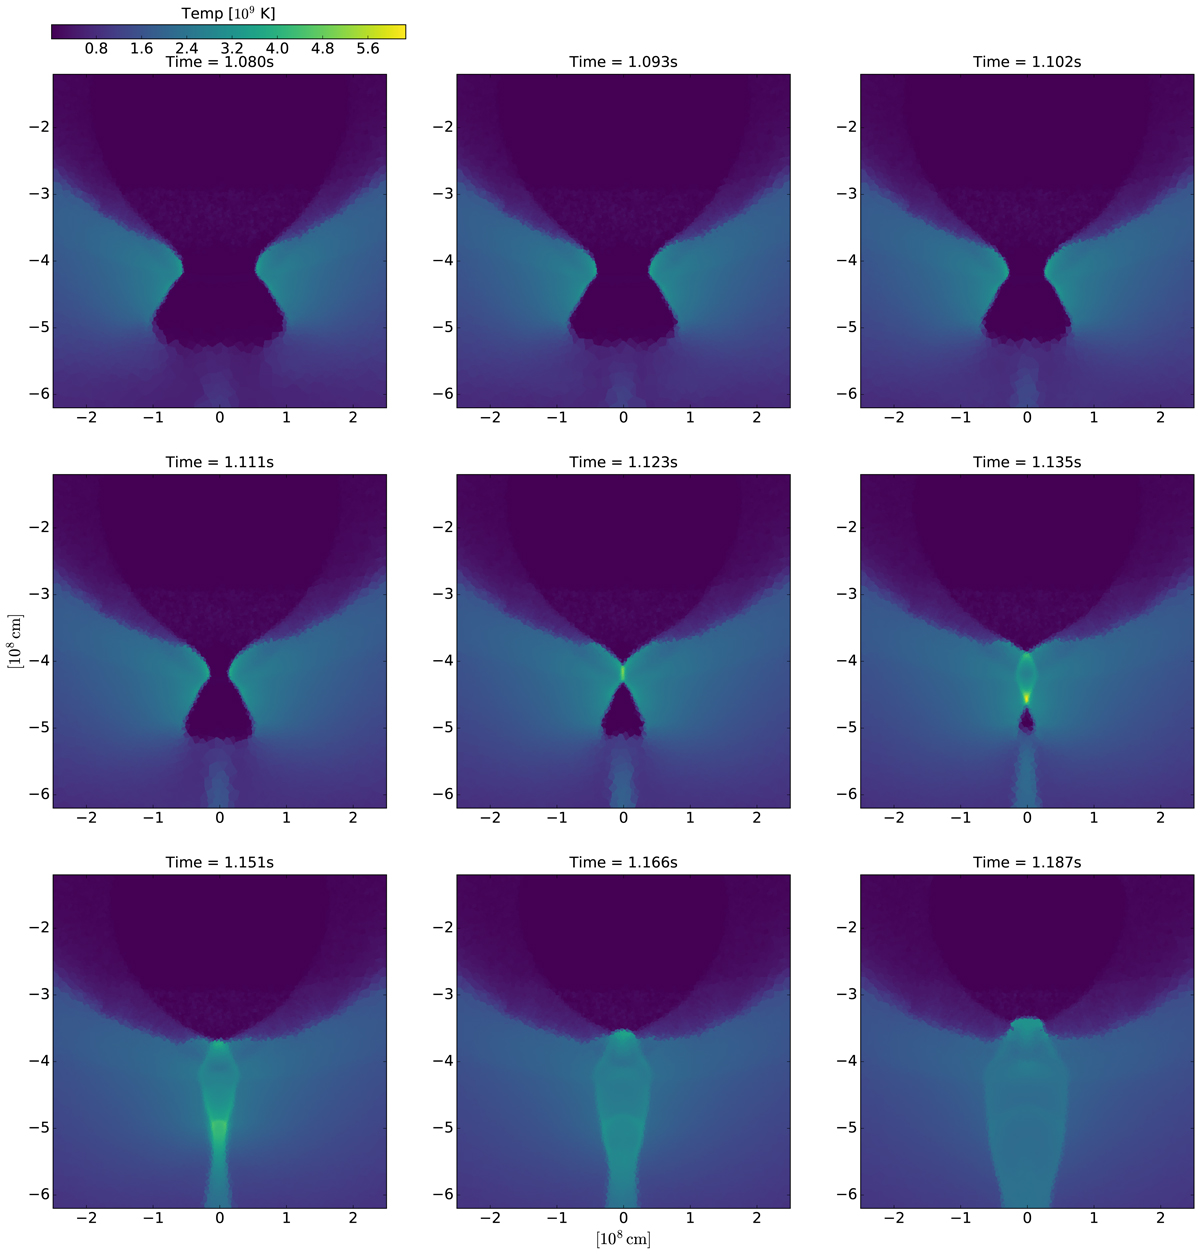
Zoom-in of Fig. 3 on the time evolution of Model M2a; temperature profile with increasing time from left to right and top to bottom: the times are indicated above each plot going from t = 1.080 s in the top left to t = 1.187 s in the bottom right; plotted as slices through the center of the white dwarf in the x − z plane.
Current usage metrics show cumulative count of Article Views (full-text article views including HTML views, PDF and ePub downloads, according to the available data) and Abstracts Views on Vision4Press platform.
Data correspond to usage on the plateform after 2015. The current usage metrics is available 48-96 hours after online publication and is updated daily on week days.
Initial download of the metrics may take a while.