Fig. 15.
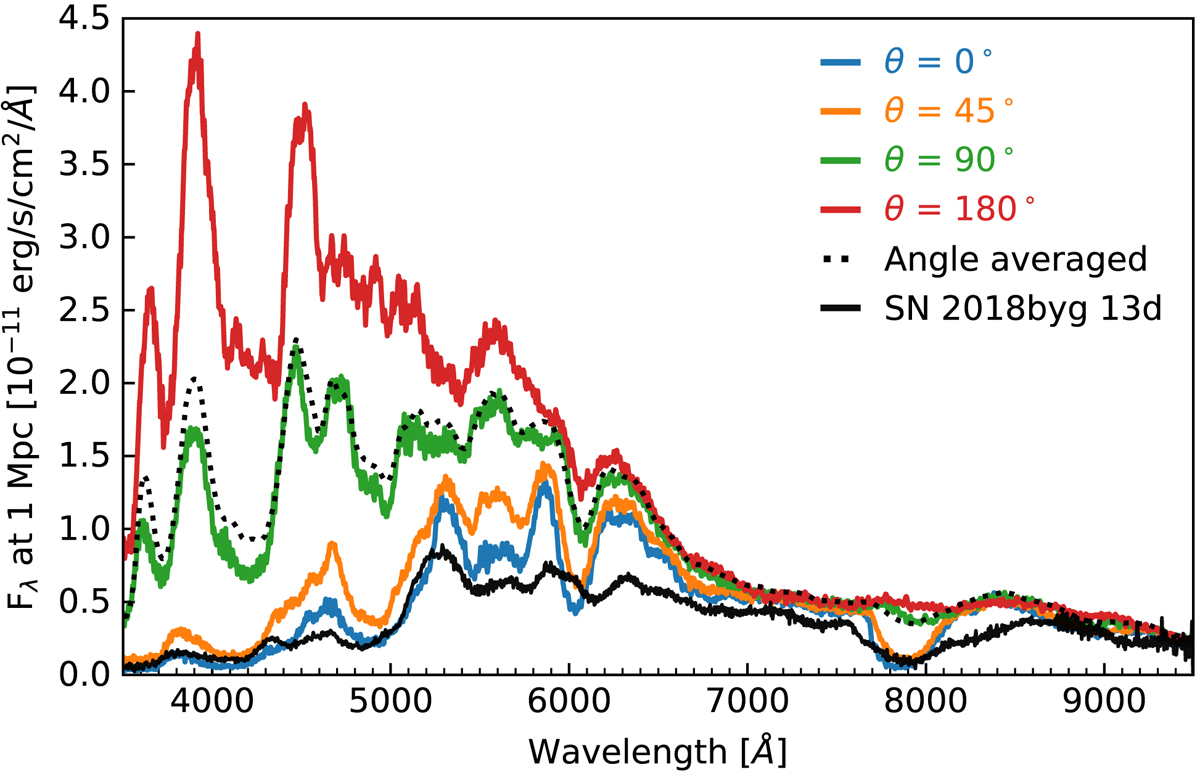
Viewing angle dependent spectra for Model M2a at 12 days after explosion. We show the spectra for viewing angles of θ = 0°, 45°, 90°, and 180°, and plot the angle averaged spectrum for comparison. Also plotted is the spectrum of SN 2018byg at a similar epoch (13 days after explosion). The spectrum of SN 2018byg has been de-reddened and redshift corrected.
Current usage metrics show cumulative count of Article Views (full-text article views including HTML views, PDF and ePub downloads, according to the available data) and Abstracts Views on Vision4Press platform.
Data correspond to usage on the plateform after 2015. The current usage metrics is available 48-96 hours after online publication and is updated daily on week days.
Initial download of the metrics may take a while.