Free Access
Fig. 14.
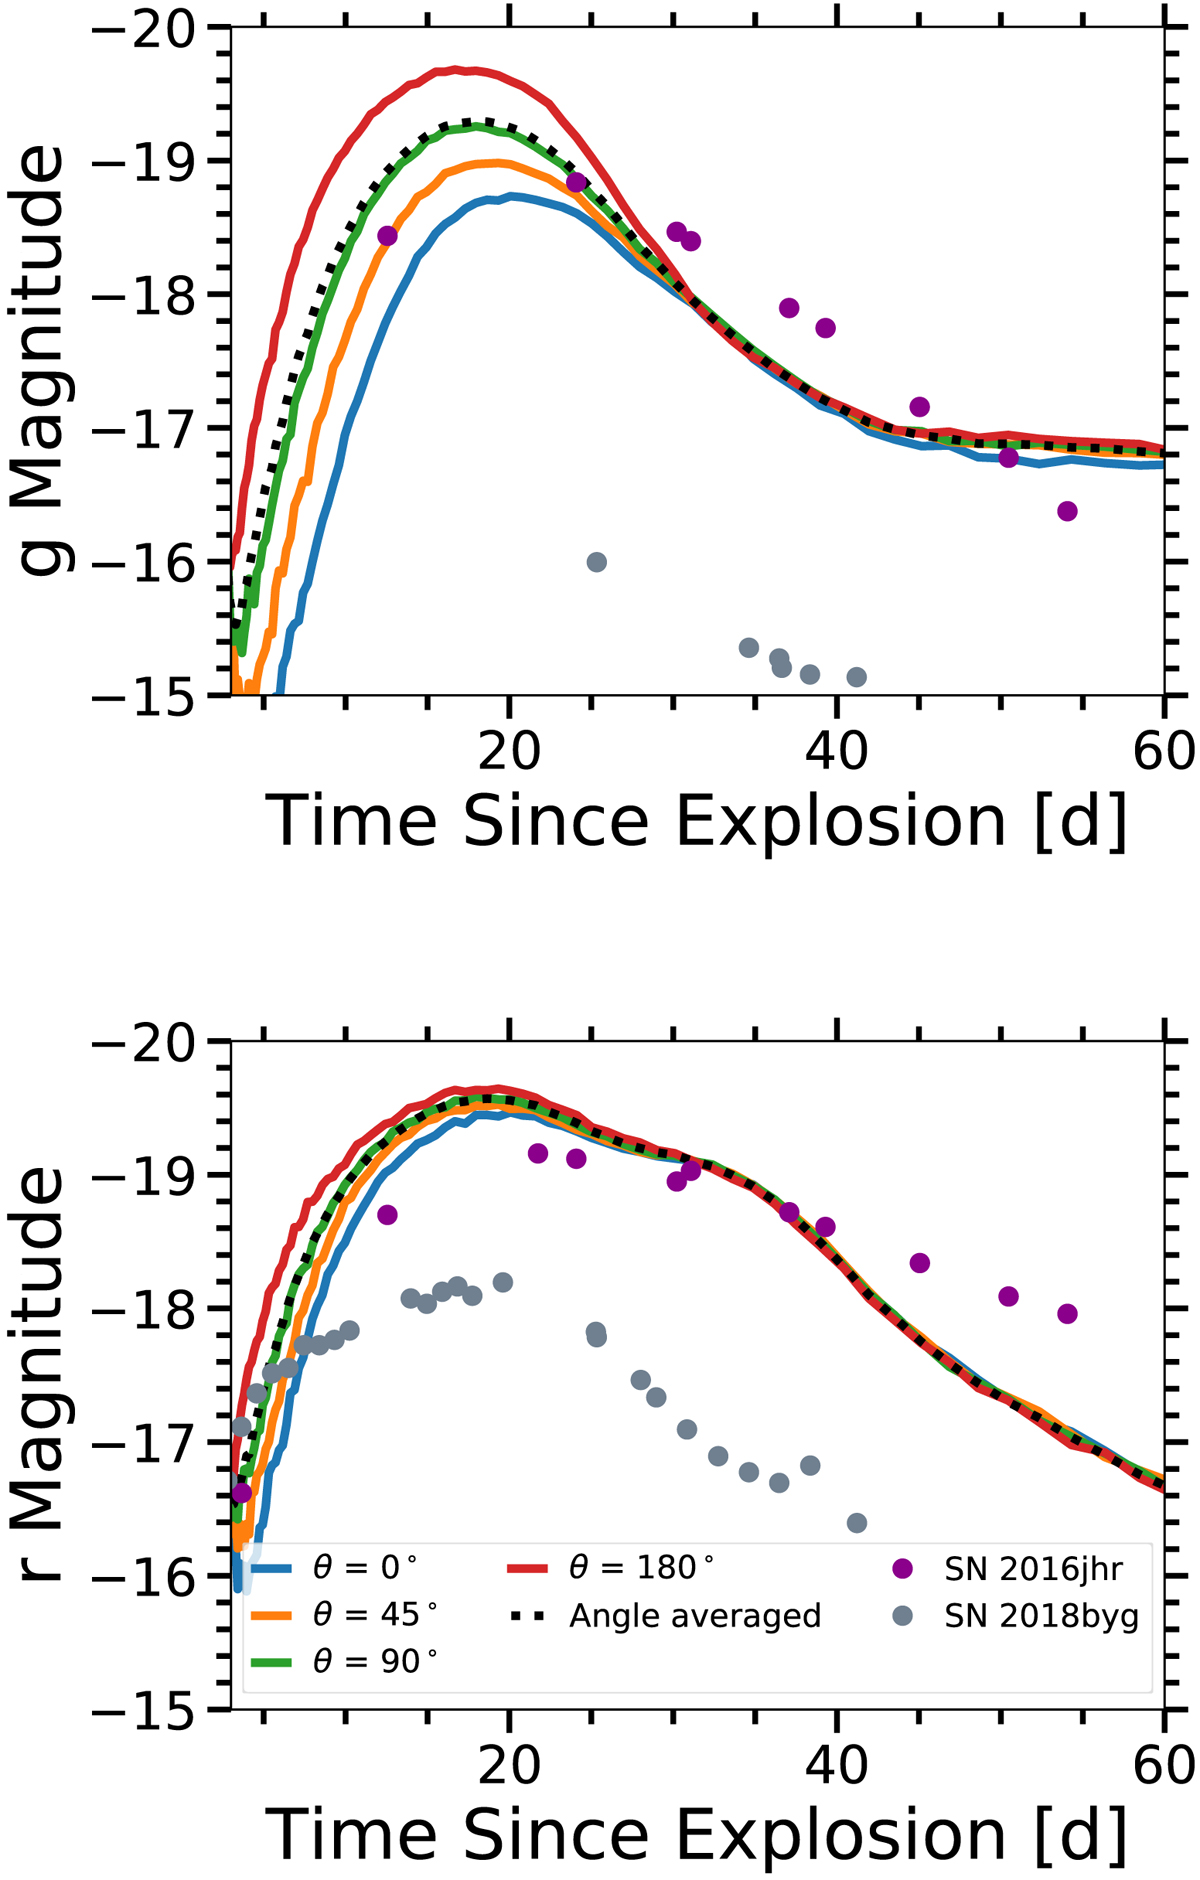
Viewing angle dependent g and r band limited light curves for Model M2a, compared to the light curves for SN 2016jhr and SN 2018byg. The angle averaged light curves are plotted (dotted black line) for reference.
Current usage metrics show cumulative count of Article Views (full-text article views including HTML views, PDF and ePub downloads, according to the available data) and Abstracts Views on Vision4Press platform.
Data correspond to usage on the plateform after 2015. The current usage metrics is available 48-96 hours after online publication and is updated daily on week days.
Initial download of the metrics may take a while.