Fig. 1.
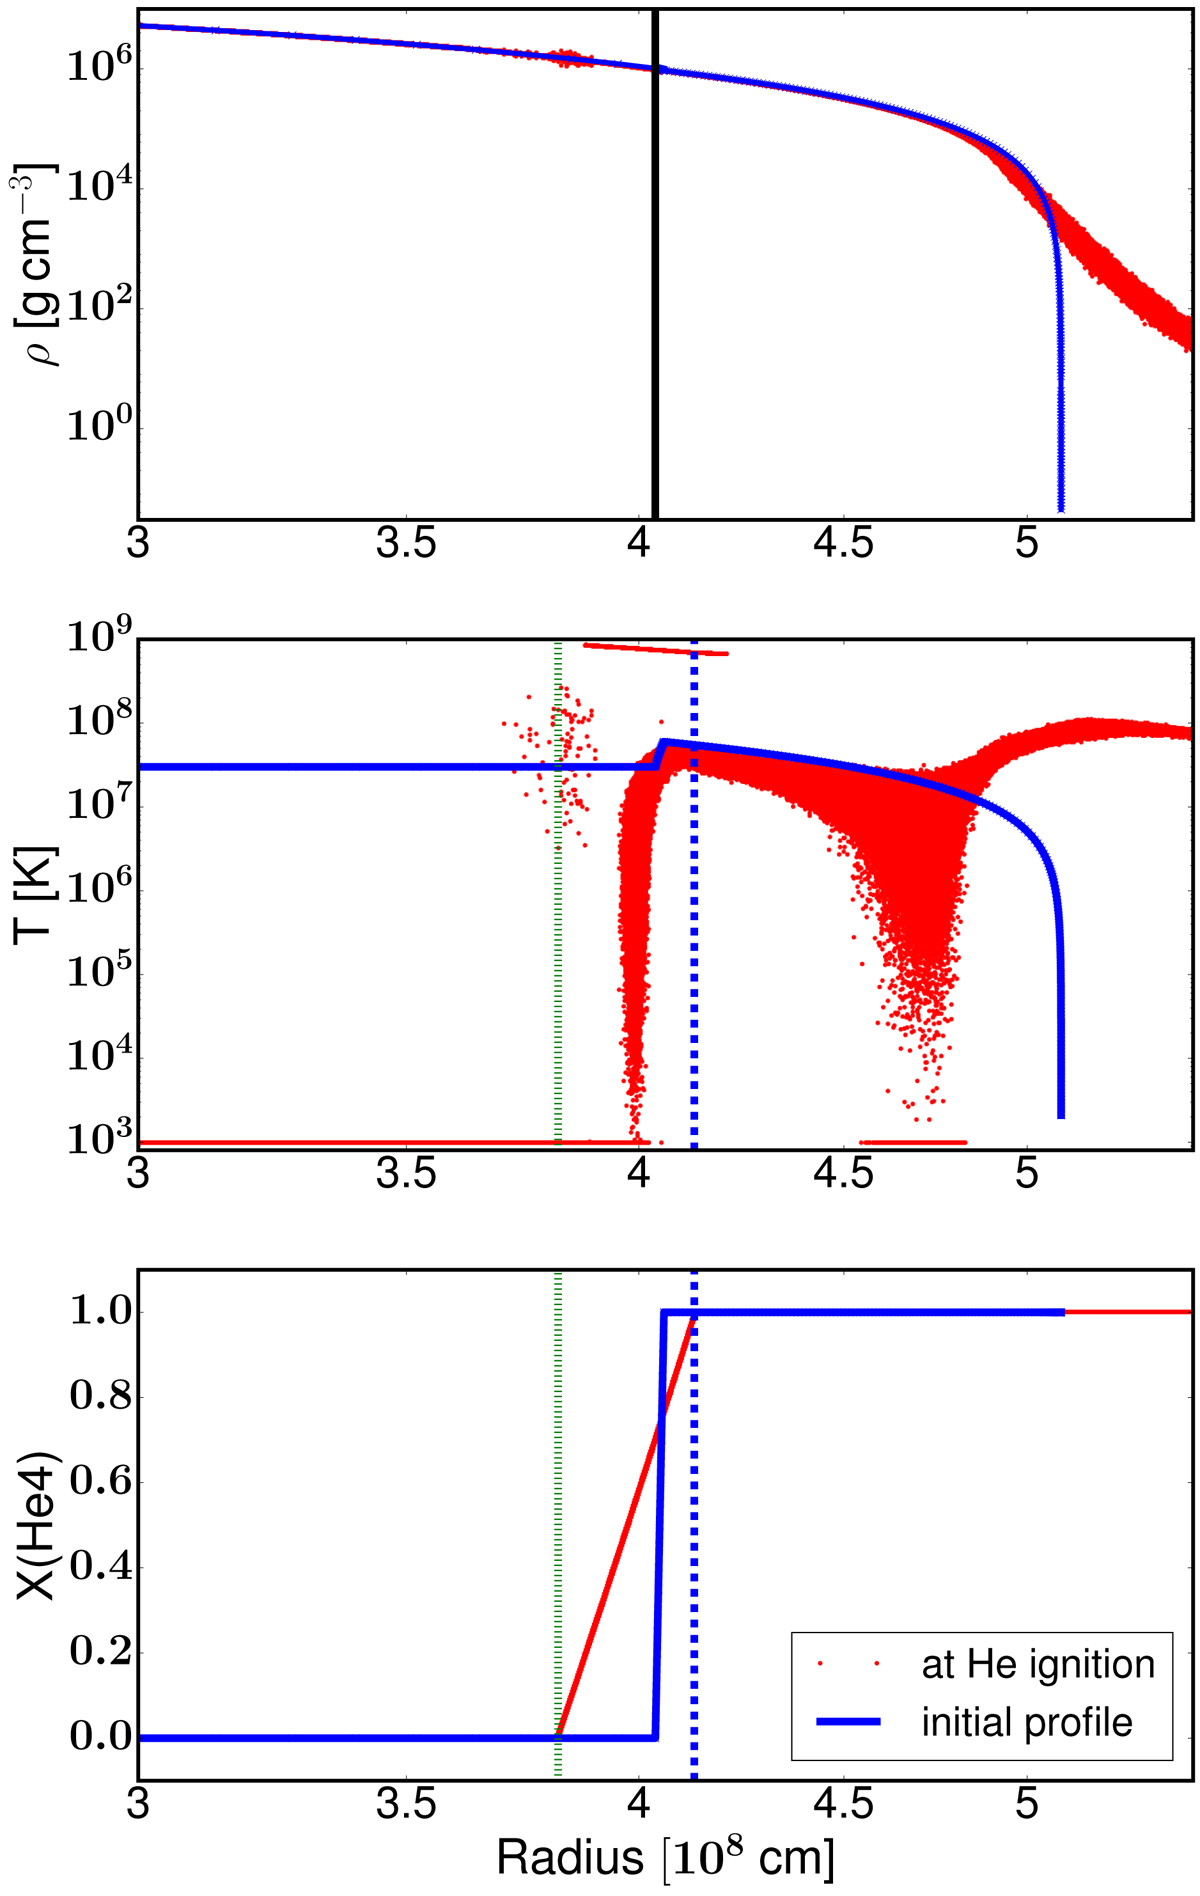
Radial profile of the density, temperature, and helium mass fraction in an interval of 3−5.5 × 108 cm of the initial setup and at helium ignition of Model M2a; the black solid, green dotted, and blue dashed lines represent the core-shell transition, base of the helium shell, and outer edge of the transition region, respectively; the cells with temperatures higher than 7 × 10⁸ K in the profile at He ignition represent the detonating cells of the He detonation.
Current usage metrics show cumulative count of Article Views (full-text article views including HTML views, PDF and ePub downloads, according to the available data) and Abstracts Views on Vision4Press platform.
Data correspond to usage on the plateform after 2015. The current usage metrics is available 48-96 hours after online publication and is updated daily on week days.
Initial download of the metrics may take a while.