Fig. 3.
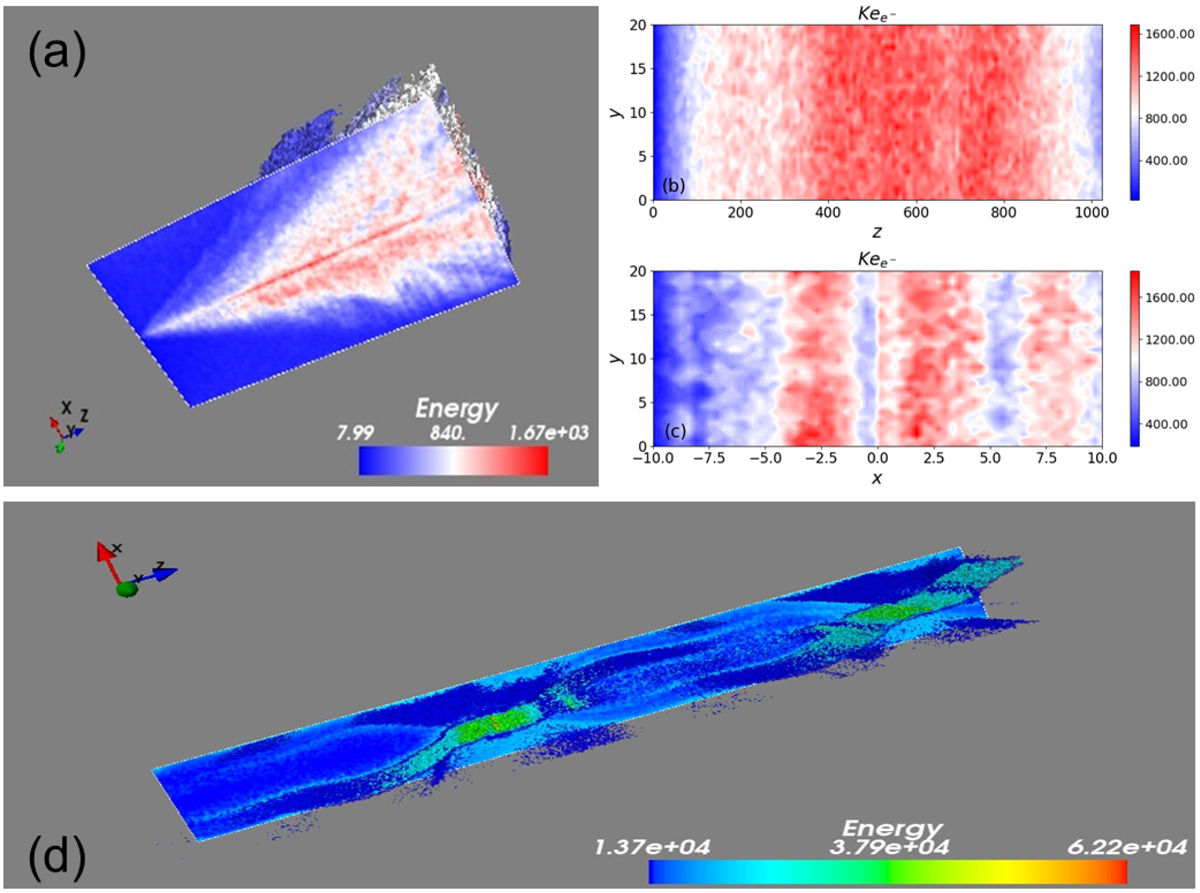
Upper plot (a): x−z cut (the front plane) and the isosurface (behind the plane) of the electron energy at t = 1500 Ω−1 in the 3D simulation. Upper right plots: (b) corresponding picture on the y−z plane at x = 0, (c): contour on the x−y plane at z = 960. The parameters are By/B0 = 0.1, Bx/B0 = 0.02, B0 = 10−3 T, and E0 = 250 V m−1. Bottom panel (d): isosurface of the proton energy in the whole simulation domain including the x−z cut at y = 0 (Parameters and more details are explained in the next Sect. 3.2.1).
Current usage metrics show cumulative count of Article Views (full-text article views including HTML views, PDF and ePub downloads, according to the available data) and Abstracts Views on Vision4Press platform.
Data correspond to usage on the plateform after 2015. The current usage metrics is available 48-96 hours after online publication and is updated daily on week days.
Initial download of the metrics may take a while.