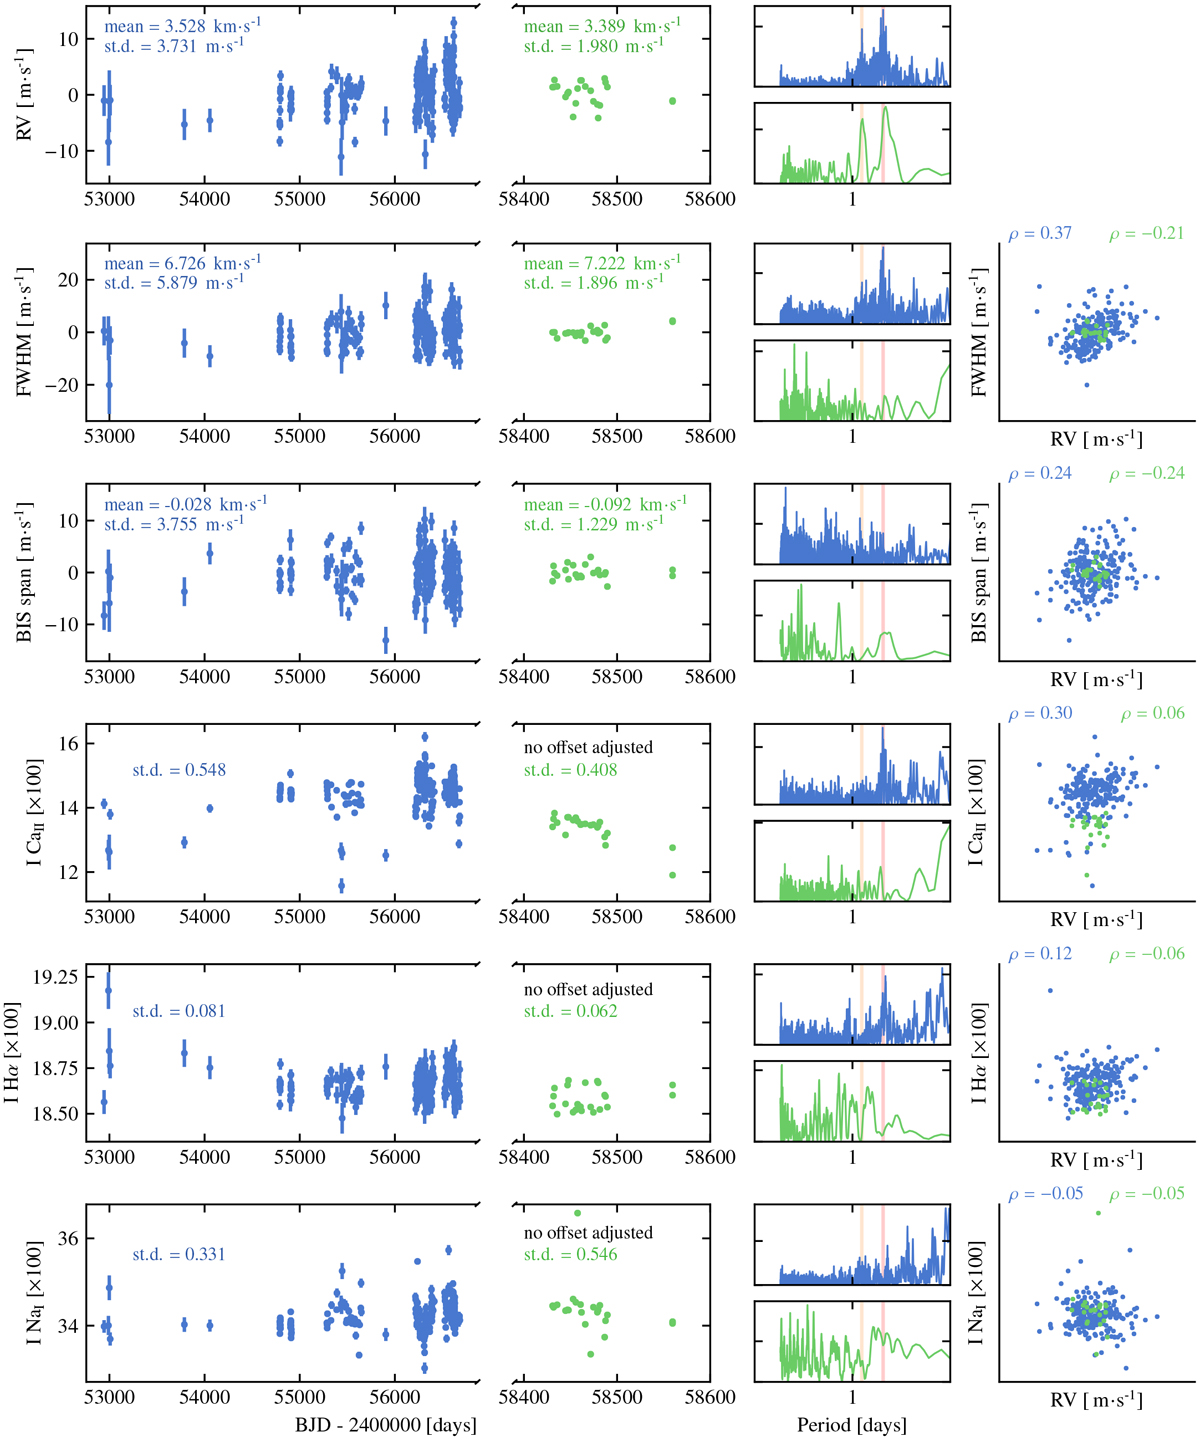
Fig. 2

Left: time series of RVs, CCF FWHM, CCF bisector span, ICa II, IH α, and INa I for HARPS (blue) and ESPRESSO (green). The vertical scales are the same in both broken panels. For the RVs, FWHM, and BIS span an offset between the two instruments was adjusted and subtracted. The average values before this offset are shown in the panels. Middle: Bayesian Lomb-Scargle periodograms of the HARPS and ESPRESSO observations. The red lines indicate the periods of 13.3 and 25.6 days. Right: correlation of each activity indicator with the RVs, showing Pearson’s correlation coefficient individually for the two instruments.
Current usage metrics show cumulative count of Article Views (full-text article views including HTML views, PDF and ePub downloads, according to the available data) and Abstracts Views on Vision4Press platform.
Data correspond to usage on the plateform after 2015. The current usage metrics is available 48-96 hours after online publication and is updated daily on week days.
Initial download of the metrics may take a while.


