Fig. 8.
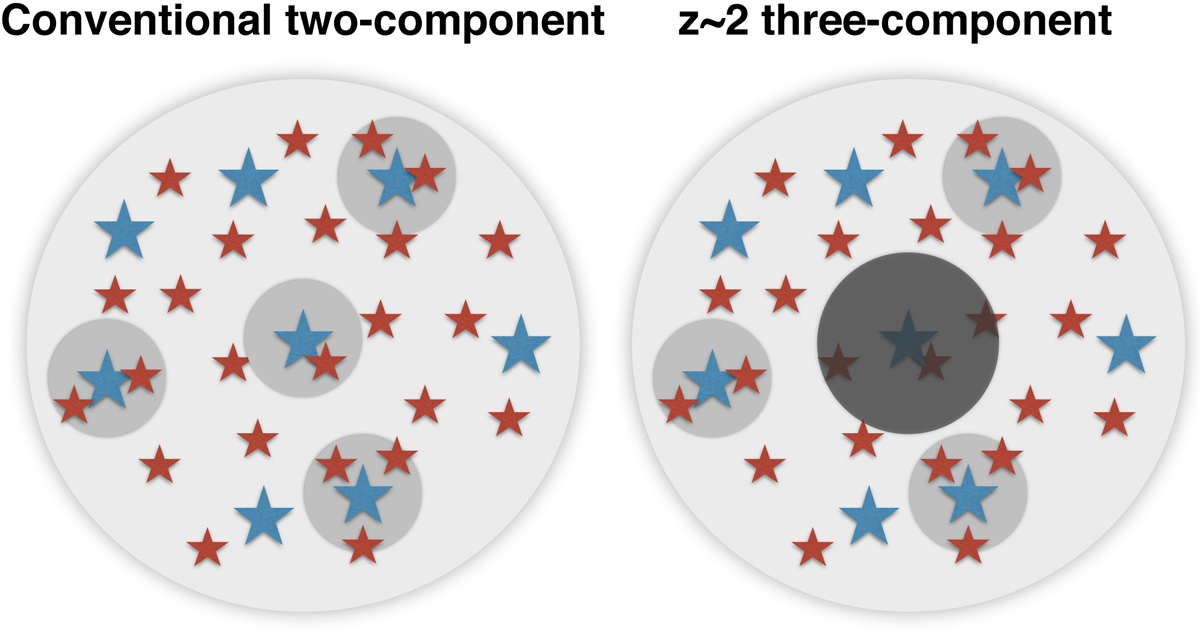
Schematic figure showing the conventional two-component view of the dust distribution and the postulated three-component model that is supported by our measurements as well as literature studies on some z ∼ 2 galaxies with lower IR luminosities. The red stars represent older stellar populations that dominate the integrated rest-frame UV to NIR, while the blue stars represent the young star-forming H II regions traced by Hα. The gray regions show the rough distributions of dust with the opacity reflecting their total attenuation, meaning that the darker regions are more obscured than the lighter ones.
Current usage metrics show cumulative count of Article Views (full-text article views including HTML views, PDF and ePub downloads, according to the available data) and Abstracts Views on Vision4Press platform.
Data correspond to usage on the plateform after 2015. The current usage metrics is available 48-96 hours after online publication and is updated daily on week days.
Initial download of the metrics may take a while.