Fig. 7.
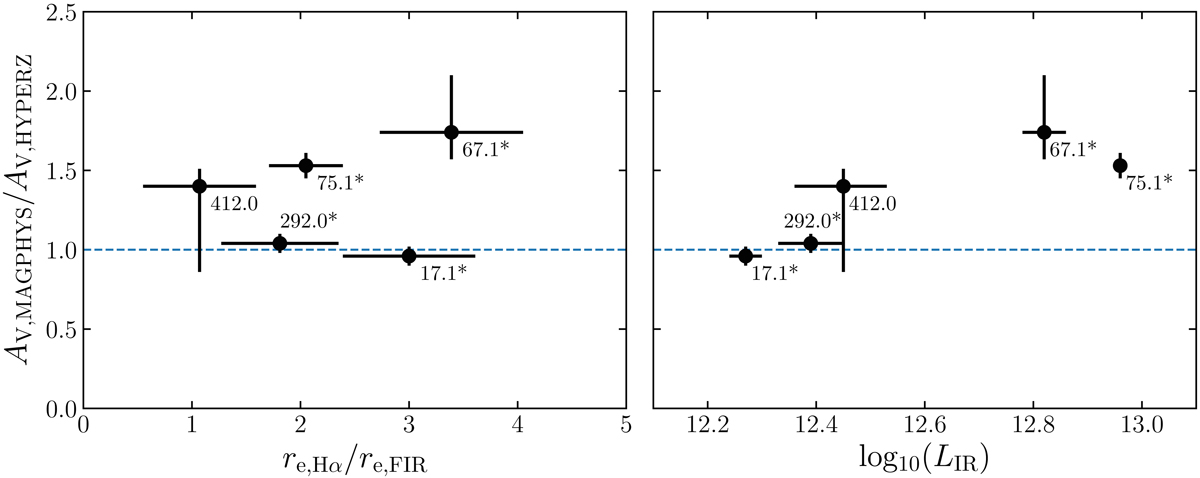
Comparison of the ratio of the total attenuation derived from the best-fit model of MAGPHYS to that of HYPERZ, the size ratio of Hα to the FIR continuum (left), and the total infrared luminosity (right). Data points are plotted along with their corresponding IDs, which have their field names removed for clarity. Sources that are identified to host an AGN are marked with an asterisk after the ID. We find a correlation between the ratio of attenuation and the infrared luminosity.
Current usage metrics show cumulative count of Article Views (full-text article views including HTML views, PDF and ePub downloads, according to the available data) and Abstracts Views on Vision4Press platform.
Data correspond to usage on the plateform after 2015. The current usage metrics is available 48-96 hours after online publication and is updated daily on week days.
Initial download of the metrics may take a while.