Fig. 6.
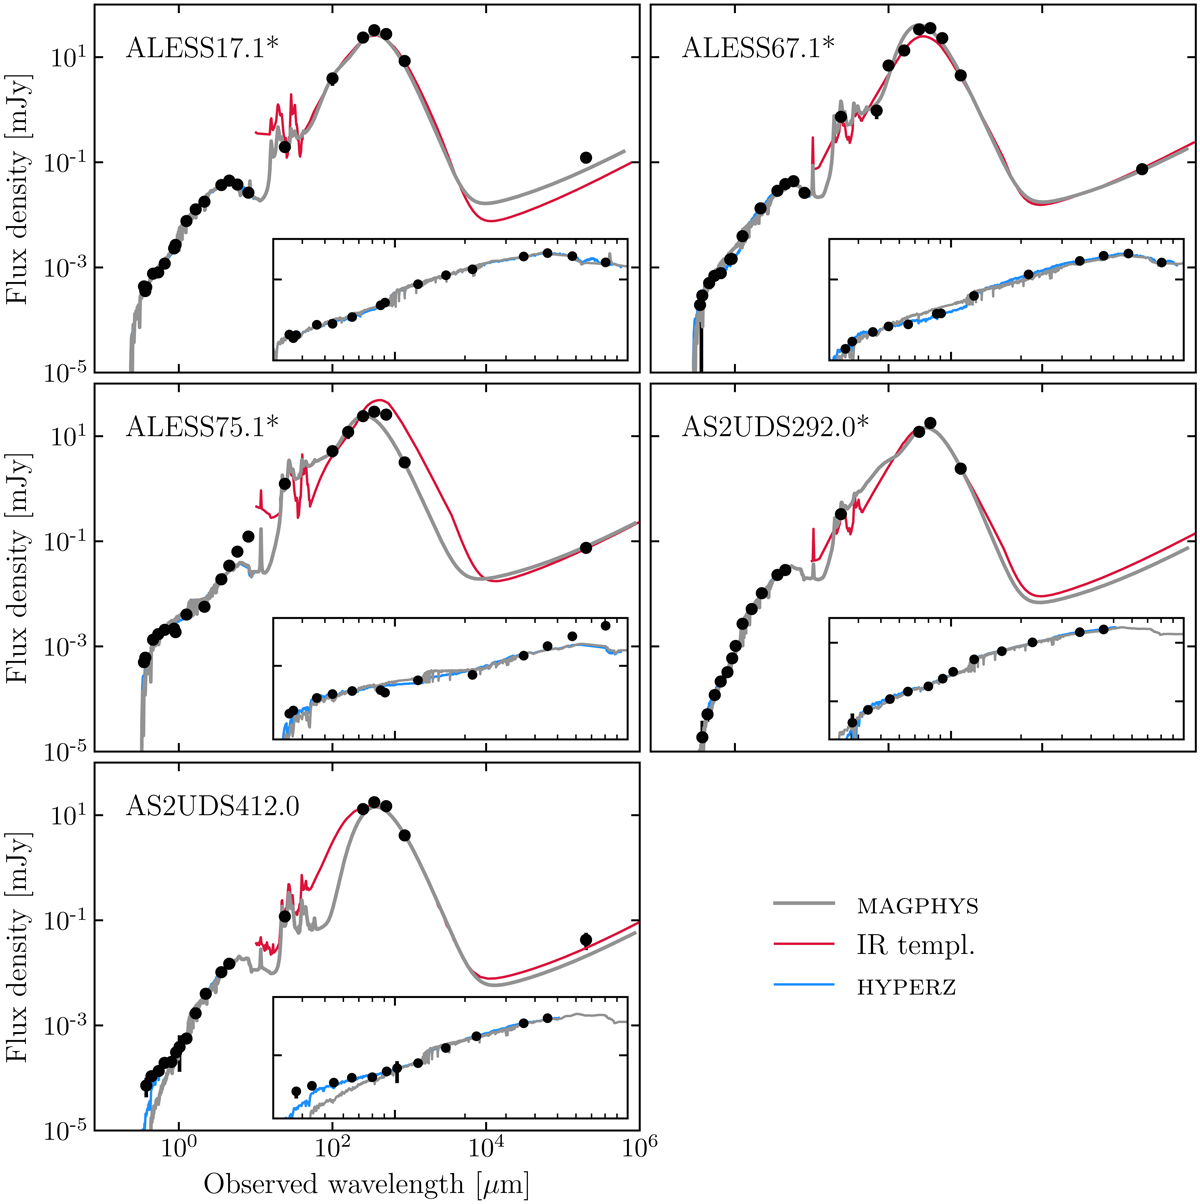
UV-to-radio SEDs for each of our sample SMGs except ALESS66.1 for which the UV-to-NIR photometric measurements are contaminated by a foreground quasar Simpson et al. (2014). Sources that are identified to host an AGN are marked with an asterisk after the ID. The measurements are plotted as black points and the best-fit models from MAGPHYS, HYPERZ, and the IR templates compiled by Swinbank et al. (2014) are plotted as gray, blue, and red curves, respectively. For clarity, we do not show the uncertainty, however, it is discussed in the text, including the fact that the IR luminosities that were estimated by the two methods are in agreement with each other within the uncertainty. The insets are zoom-ins in the OIR regime from 0.3 to 10 μm in log–log scale. We find significant differences in higher LIR sources between the best-fit models of MAGPHYS and HYPERZ; also, in all of these discrepant cases, the HYPERZ modeling provides a better fit with a lower χ2.
Current usage metrics show cumulative count of Article Views (full-text article views including HTML views, PDF and ePub downloads, according to the available data) and Abstracts Views on Vision4Press platform.
Data correspond to usage on the plateform after 2015. The current usage metrics is available 48-96 hours after online publication and is updated daily on week days.
Initial download of the metrics may take a while.