Fig. 5.
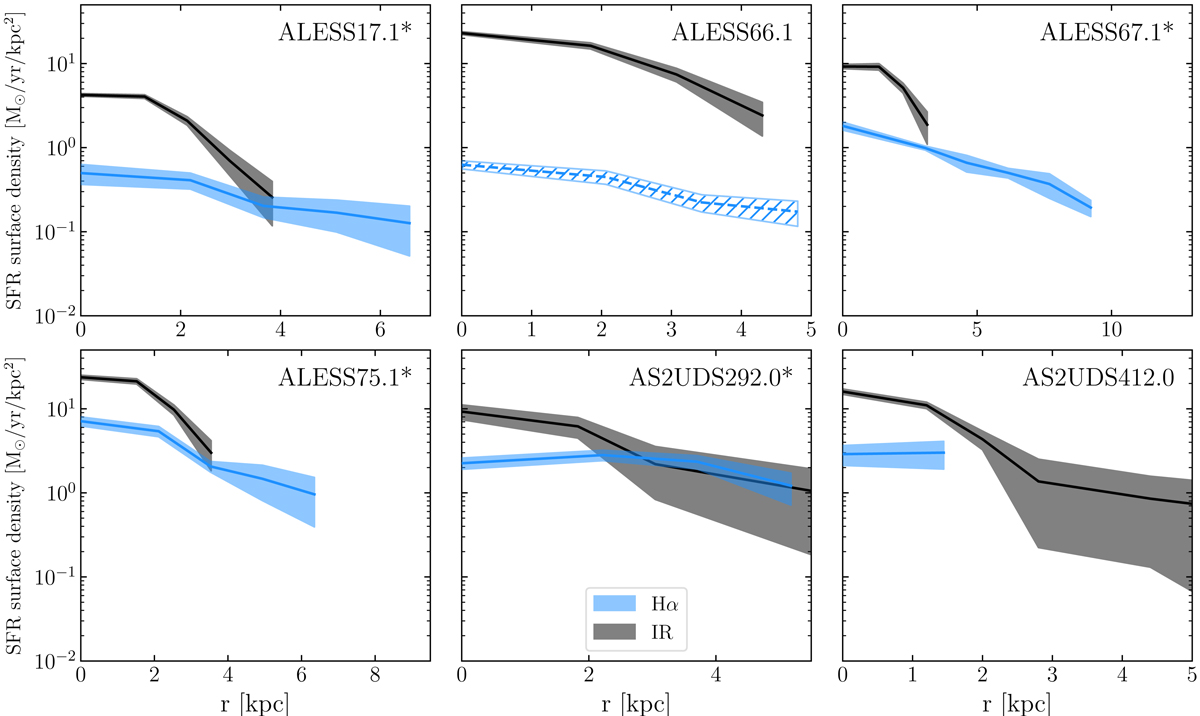
SFR density profiles based on the curve-of-growth analyses (Fig. 2), which were deconvolved according to the PSF. Sources that are identified to host an AGN are marked with an asterisk after the ID. For the IR-based profiles, we assume that they follow the morphology of the observed 870 μm emissions, meaning the IR-based SFRs in each radial bin is the fraction of the total 870 μm flux times the total SFRs. The Hα-based profiles were derived by differentiating the curve-of-growth results, converting the Hα luminosity to SFRs according to Kennicutt & Evans (2012), and adopting an attenuation correction of Calzetti et al. (2000), except for ALESS66.1 for which the OIR photometry is contaminated by a foreground quasar (Fig. 1). For ALESS66.1, we plotted the profile without correcting for attenuation. For clarity, we only plotted the bins that have ≥1σ measurements.
Current usage metrics show cumulative count of Article Views (full-text article views including HTML views, PDF and ePub downloads, according to the available data) and Abstracts Views on Vision4Press platform.
Data correspond to usage on the plateform after 2015. The current usage metrics is available 48-96 hours after online publication and is updated daily on week days.
Initial download of the metrics may take a while.