Fig. 4.
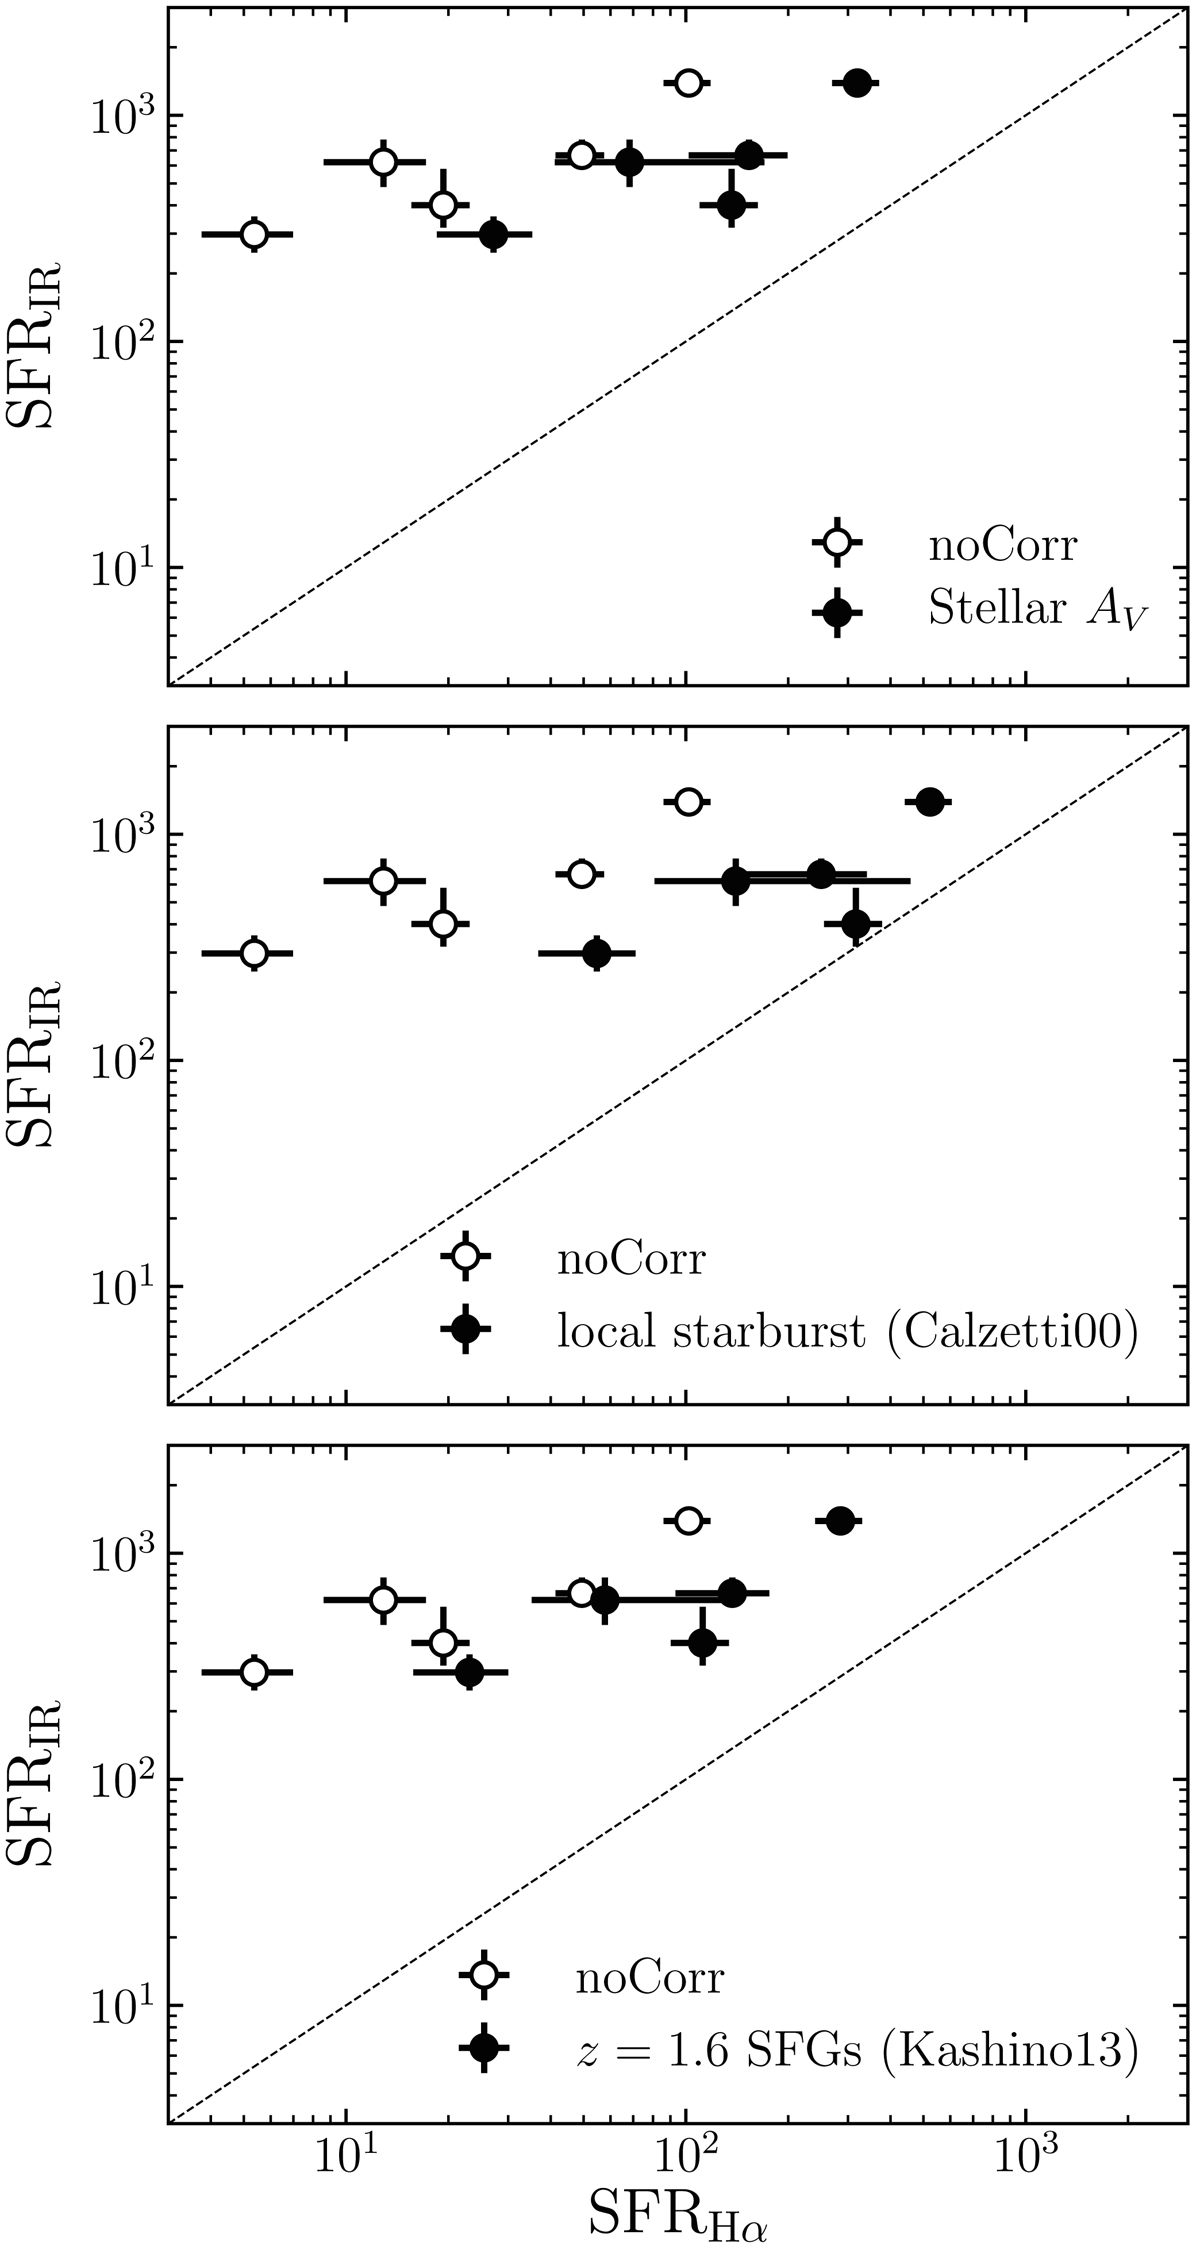
Comparison between the IR-based SFRs and the Hα-based SFRs, except for ALESS66.1, where the UV-to-NIR photometry is contaminated by a foreground nearby quasar. The derivations of SFRs are described, in detail, in Sect. 4.2.1. In each panel, the empty symbols are plotted based on the measured Hα-based SFRs without attenuation correction (noCorr), and the filled symbols are plotted based on the Hα-based SFRs corrected for attenuation using various methods: In the top panel, we adopt the stellar AV derived from the SED fitting; in the middle and bottom panels, we adopt the attenuation of the H II regions based on a fractional correction to the stellar AV provided by Calzetti et al. (2000) and Kashino et al. (2013), respectively. While the exact amount of correction for attenuation is still under debate, we find that even if we adopt the largest correction provided by Calzetti et al. (2000), the Hα-based SFRs are still a factor of 3 ± 1 lower than the IR-based SFRs on average.
Current usage metrics show cumulative count of Article Views (full-text article views including HTML views, PDF and ePub downloads, according to the available data) and Abstracts Views on Vision4Press platform.
Data correspond to usage on the plateform after 2015. The current usage metrics is available 48-96 hours after online publication and is updated daily on week days.
Initial download of the metrics may take a while.