Fig. 2.
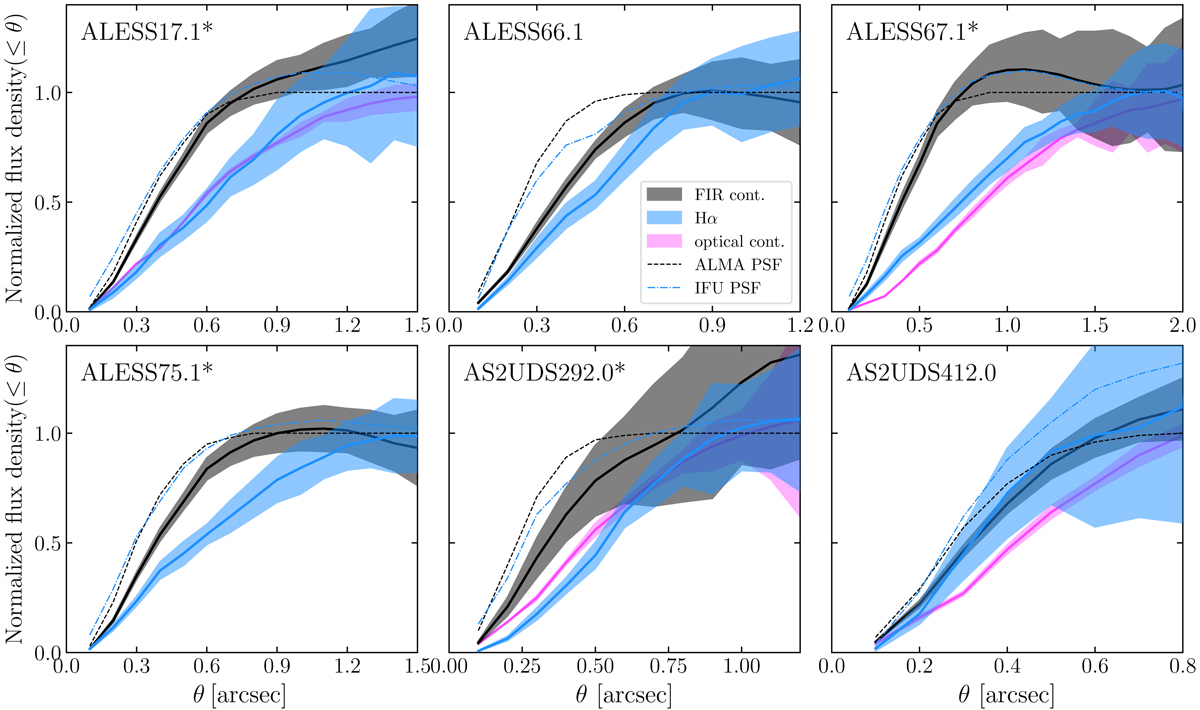
Curve-of-growth for each of our sample SMGs, showing the rest-frame FIR continuum in black, Hα in blue, and wherever available rest-frame optical continuum from HST in magenta. Sources that are identified to host an AGN are marked with an asterisk after the ID. The flux densities were normalized to the total flux densities, and the 1σ uncertainties are shown as respective color bands. All FIR and optical continuum images were convolved to a resolution that matches that of the Hα images. The curve-of-growth results for the PSFs are also shown as dashed curves, which are based on the synthesized beam for ALMA and the standard stars for the IFU data.
Current usage metrics show cumulative count of Article Views (full-text article views including HTML views, PDF and ePub downloads, according to the available data) and Abstracts Views on Vision4Press platform.
Data correspond to usage on the plateform after 2015. The current usage metrics is available 48-96 hours after online publication and is updated daily on week days.
Initial download of the metrics may take a while.