Fig. 9
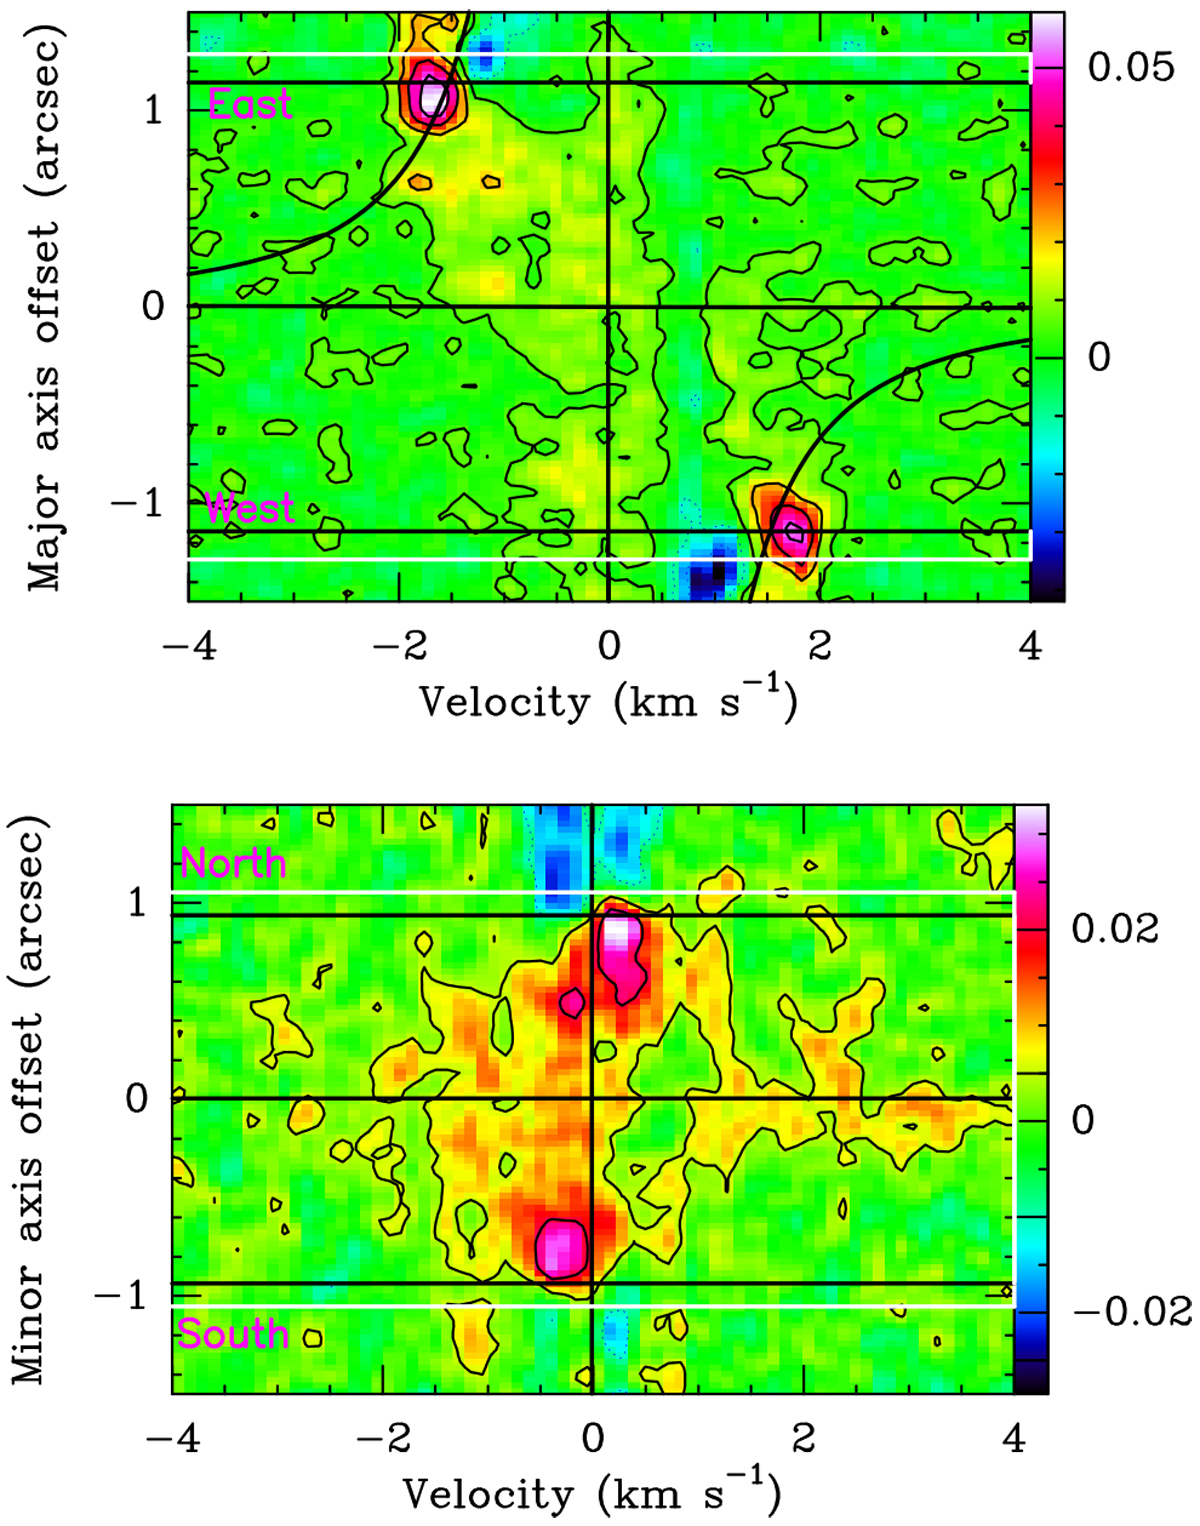
Position-velocity diagrams of the 13CO(3–2) emission in the cavity along the major (upper panel) and minor axis (lower panel). The black curves show the expected Keplerian velocity around a single star of 1.36 M⊙. Contour levels are spaced by 10 mJy beam−1; the zero contour is omitted. The white lines indicate the position of the inner edge of the dust ring (180 au) and the black lines show the position of the inner radius of the gas disk (169 au). The data were rotated by 7° to align with the disk axis, so that cardinal directions are approximate.
Current usage metrics show cumulative count of Article Views (full-text article views including HTML views, PDF and ePub downloads, according to the available data) and Abstracts Views on Vision4Press platform.
Data correspond to usage on the plateform after 2015. The current usage metrics is available 48-96 hours after online publication and is updated daily on week days.
Initial download of the metrics may take a while.