Fig. 8
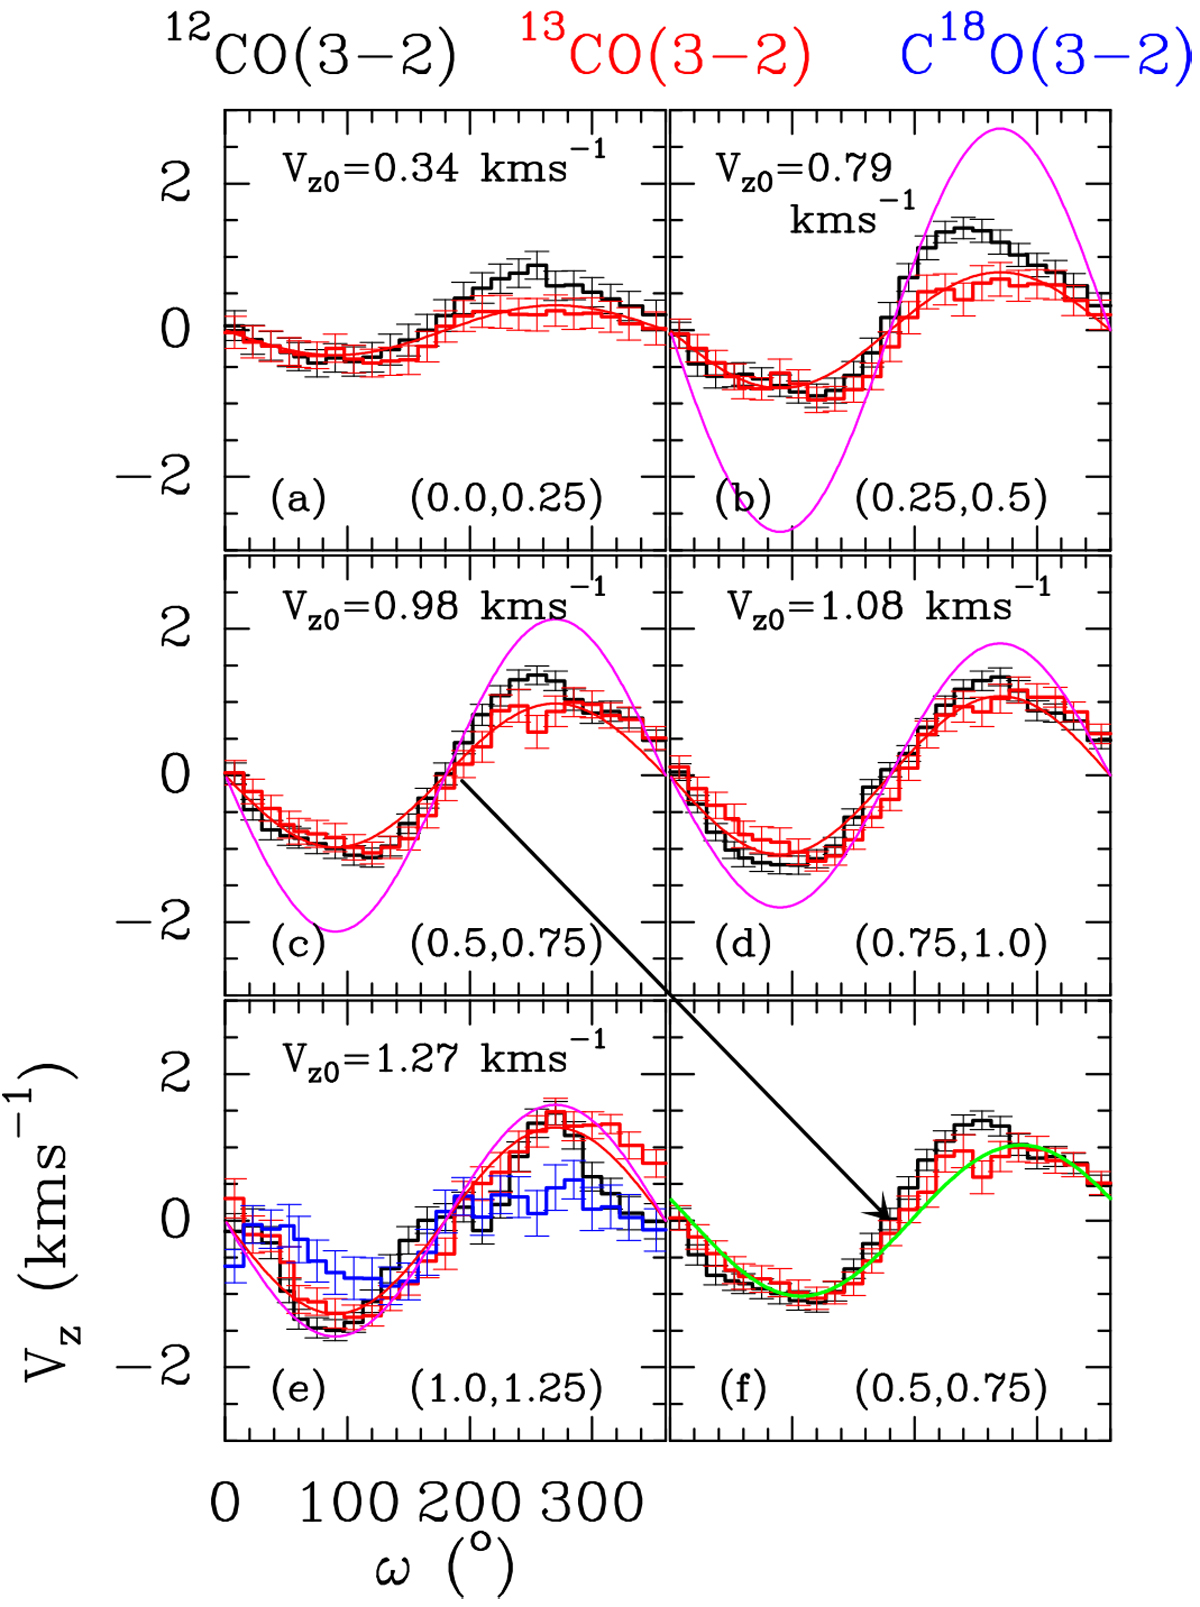
Dependence of ⟨Vz⟩ (km s −1) on the azimuth ω (°) in the cavity.12CO (3–2) is in black, 13CO (3–2) in red and C18O (3–2) in blue. The red curve is a fit of a sine function to the 13CO (3–2) data (see text). We use a blank space when no good data are available (no emission) in the ring. The magenta curves show the expected Keplerian velocity around a single star of 1.36 M⊙. The green curve in panel f shows the best-fit velocity curve when infall motions are allowed, superimposed on the 13CO velocity.
Current usage metrics show cumulative count of Article Views (full-text article views including HTML views, PDF and ePub downloads, according to the available data) and Abstracts Views on Vision4Press platform.
Data correspond to usage on the plateform after 2015. The current usage metrics is available 48-96 hours after online publication and is updated daily on week days.
Initial download of the metrics may take a while.