Fig. 3
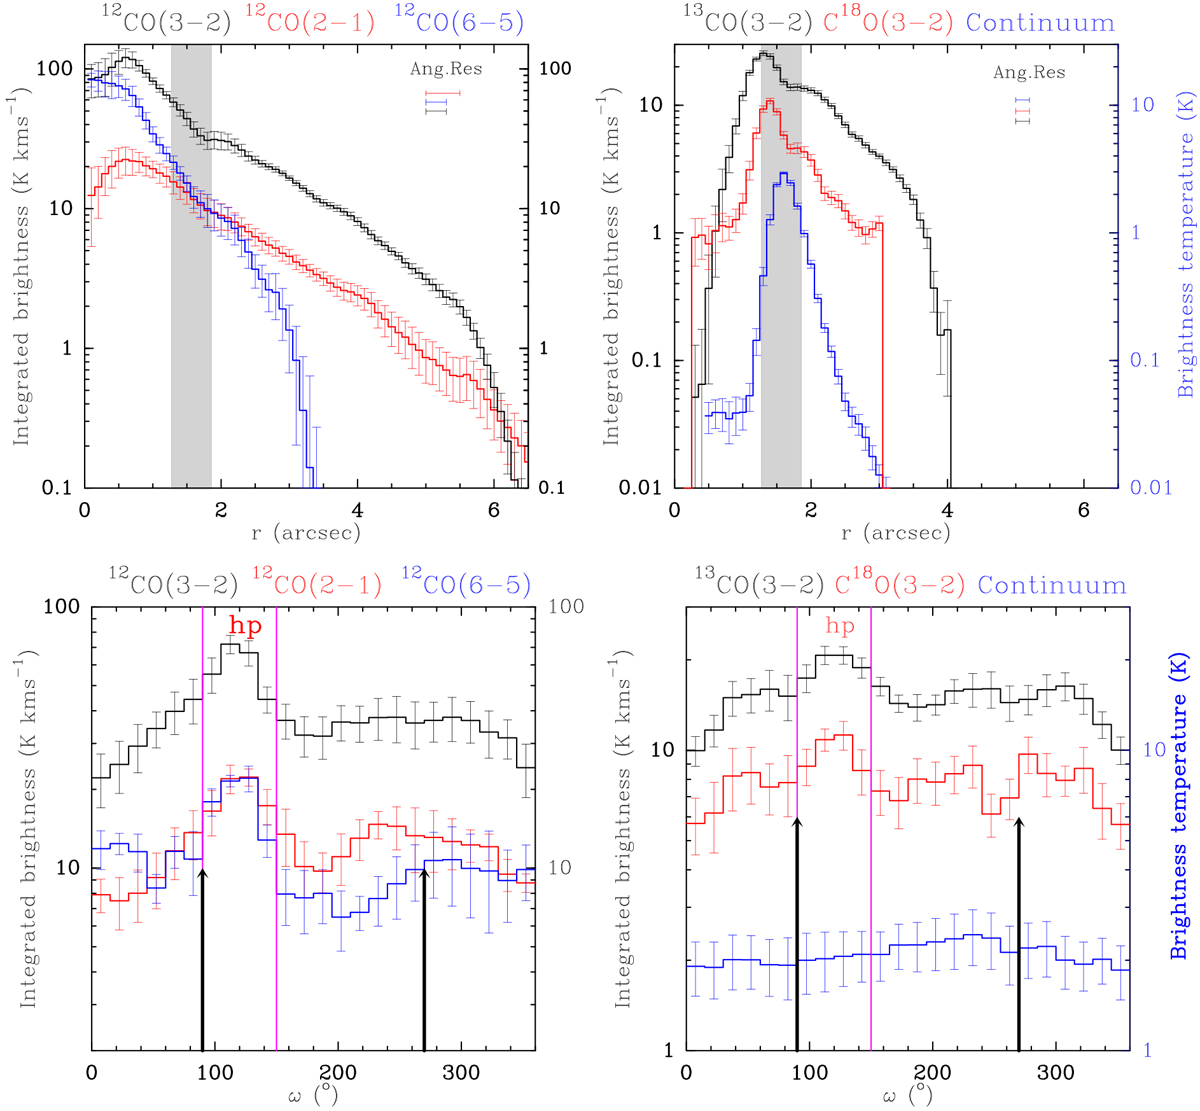
Upper panels: radial dependence of the integrated brightness temperature (for lines) and brightness temperature (for continuum emission) in the disk plane. The horizontal sticks indicate the angular resolutions. Lower panels: azimuthal dependence of the same quantities averaged over the ring of 1.2″ < r < 2.0″. Left panels: plot of the emission from the J = 6–5, 3–2 and 2–1 lines of 12CO. For a description of the corresponding data, see Tang et al. (2016) for the J = 3–2 line and Dutrey et al. (2014) for the others. Right panels: less abundant CO isotopologs (J = 3–2) emissions. The gray region delineates the dust ring in the upper panels. In the lower panels, black arrows show the location of the limb-brightening peaks and the magenta lines show the hot-spot location.
Current usage metrics show cumulative count of Article Views (full-text article views including HTML views, PDF and ePub downloads, according to the available data) and Abstracts Views on Vision4Press platform.
Data correspond to usage on the plateform after 2015. The current usage metrics is available 48-96 hours after online publication and is updated daily on week days.
Initial download of the metrics may take a while.