Open Access
Fig. 11
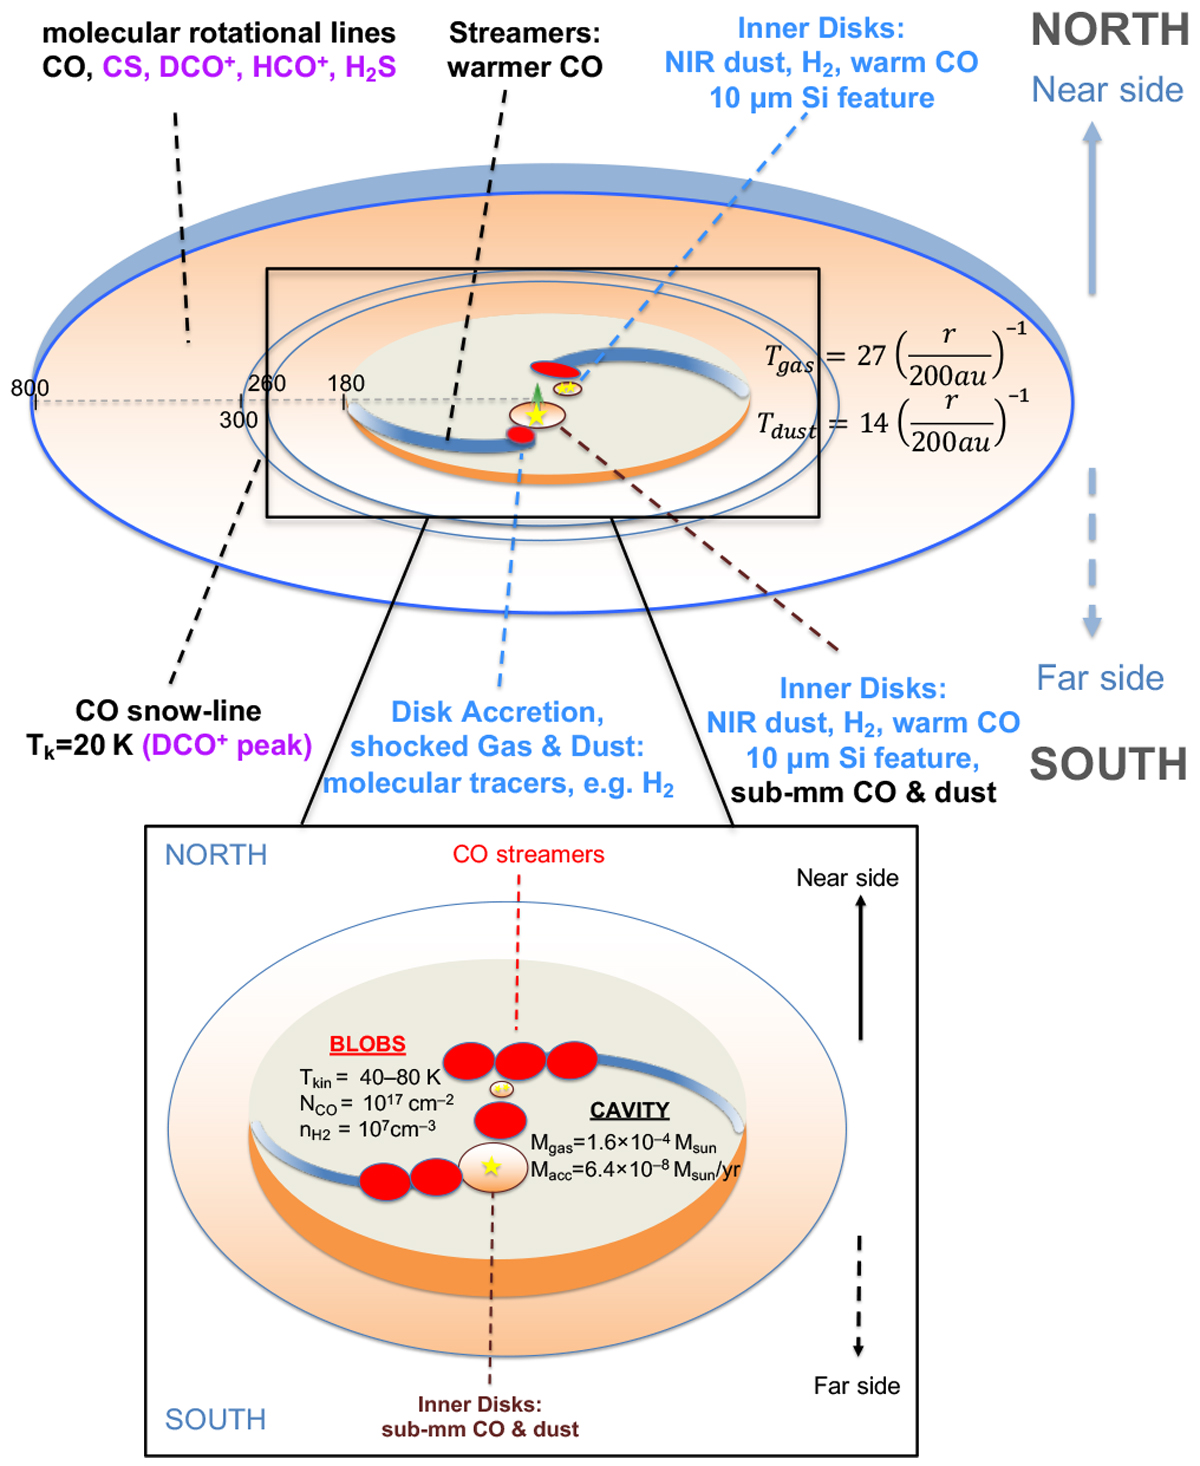
Schematic view of the GG Tauri system. Colored text indicates results obtained from other publications. In particular, magenta shows results from Phuong et al. (2018b); see Dutrey et al. (2016) for a review of other references. Black text shows results from this work.
Current usage metrics show cumulative count of Article Views (full-text article views including HTML views, PDF and ePub downloads, according to the available data) and Abstracts Views on Vision4Press platform.
Data correspond to usage on the plateform after 2015. The current usage metrics is available 48-96 hours after online publication and is updated daily on week days.
Initial download of the metrics may take a while.