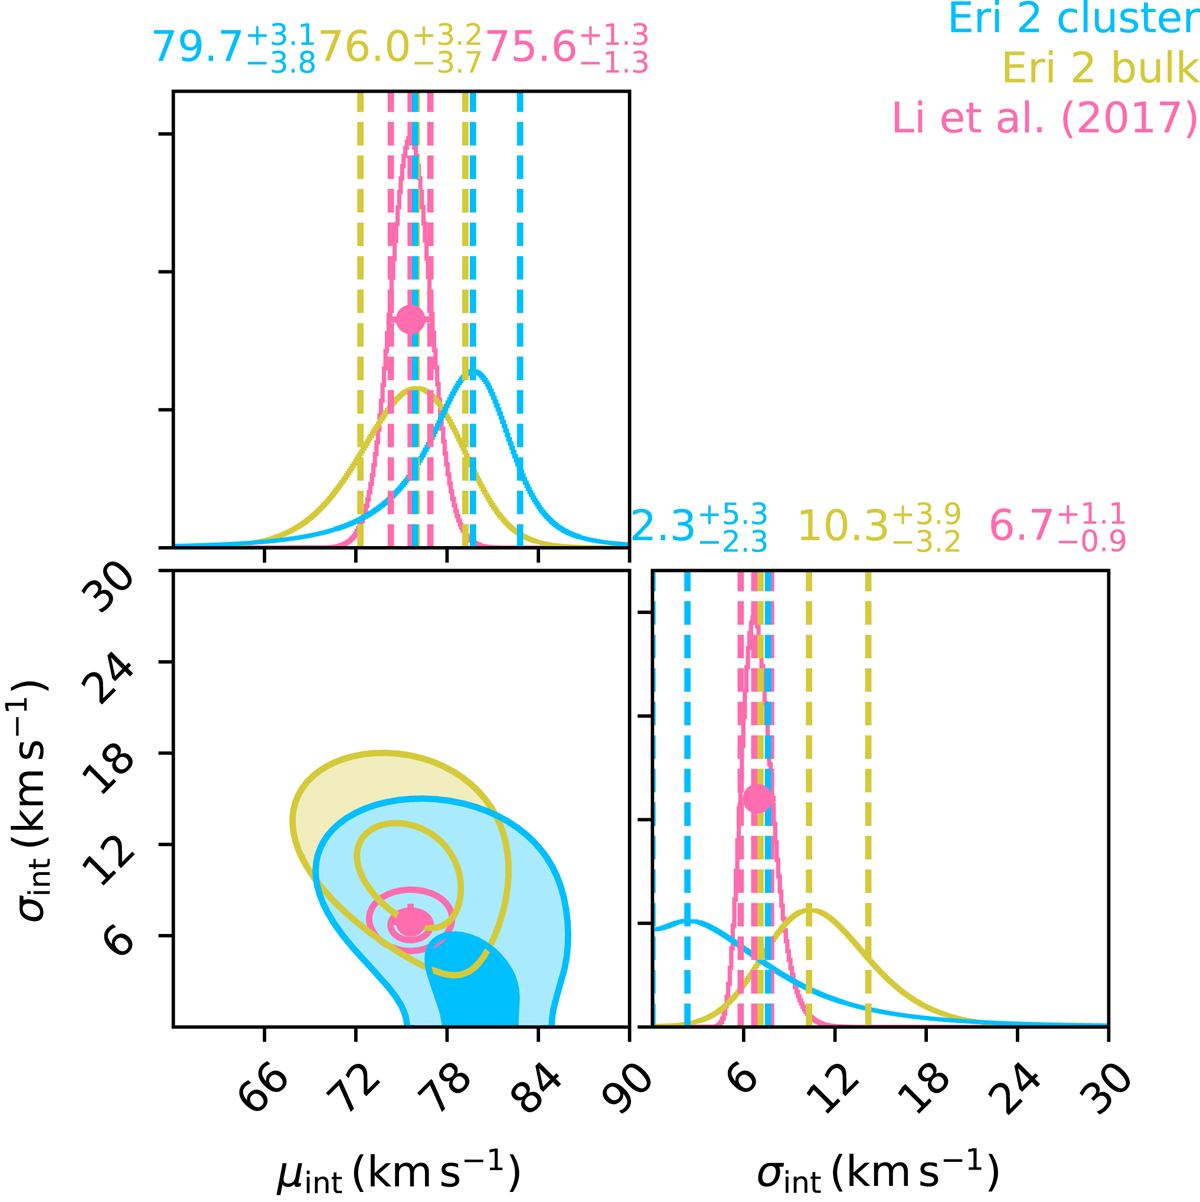
Fig. 9.

Corner plot of the distribution of line-of-sight velocities for stars in Eridanus 2, assuming normal distributions with intrinsic mean μint and intrinsic dispersion σint. The blue, yellow, and pink contours indicate the 39- and 86% confidence areas (equivalent to 1- and 2-σ for a two-dimensional normal distribution) for stars in the putative star cluster (marginalized over cluster membership), stars in the bulk of Eridanus 2 (marginalized over cluster membership for possible cluster member stars), and stars at a larger radius as measured by Li et al. (2017). The maxima of the one-dimensional posteriors and the 68% confidence interval around it are indicated in the same colours above the on-diagonal panels. The pink circle and error bars indicate the result Li et al. (2017) themselves derive from their measurements.
Current usage metrics show cumulative count of Article Views (full-text article views including HTML views, PDF and ePub downloads, according to the available data) and Abstracts Views on Vision4Press platform.
Data correspond to usage on the plateform after 2015. The current usage metrics is available 48-96 hours after online publication and is updated daily on week days.
Initial download of the metrics may take a while.


