Fig. 3.
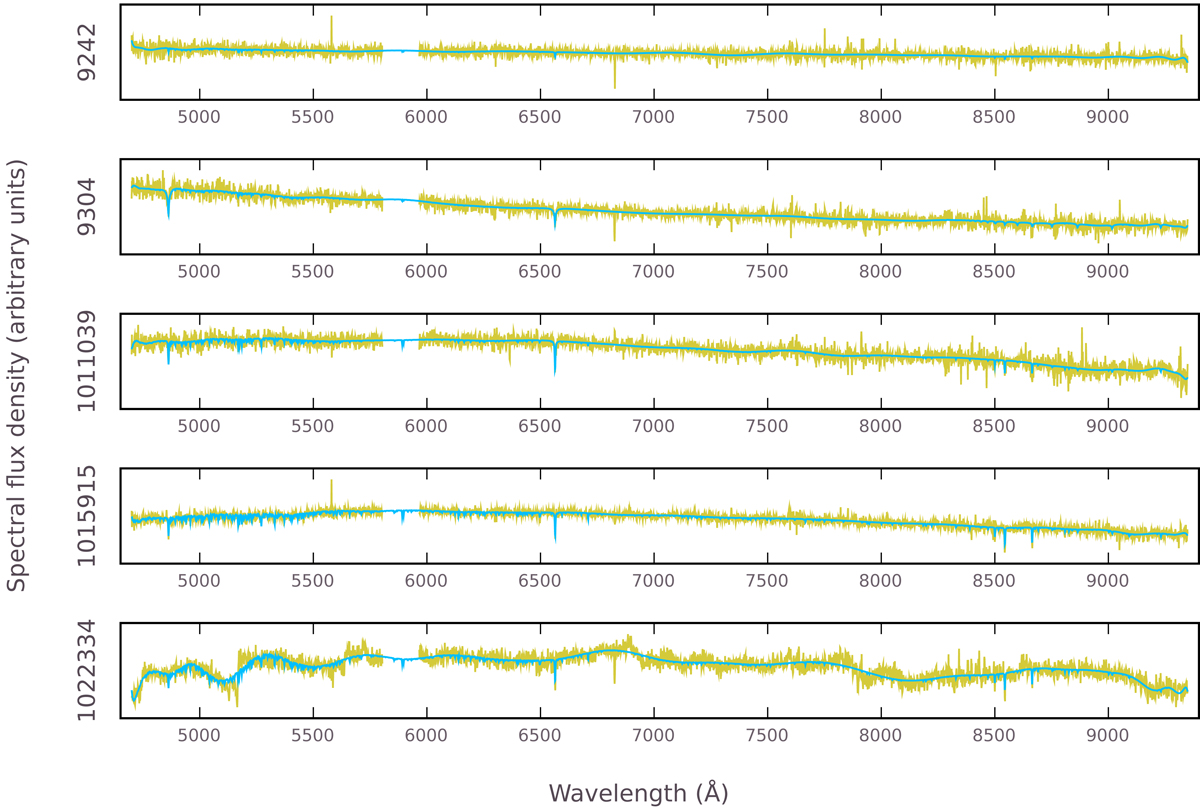
Illustration of typical spectra at different signal-to-noise levels, with source IDs shown on the left. These spectra have empirical signal-to-noise ratios of 6, 8, 17, 28, and 15, from top to bottom. The extracted spectra are shown in yellow, with the best-fitting spectra found by spexxy overplotted in blue. The gap in the observed spectrum just blueward of 6000 Å is masked because it contains the Na D emission of the adaptive optics laser. The last source is a carbon star; as the PHOENIX library used with spexxy does not include these type of stars, the best-fitting spectrum matches the absorption lines but can only approximate the carbon features with a polynomial fit.
Current usage metrics show cumulative count of Article Views (full-text article views including HTML views, PDF and ePub downloads, according to the available data) and Abstracts Views on Vision4Press platform.
Data correspond to usage on the plateform after 2015. The current usage metrics is available 48-96 hours after online publication and is updated daily on week days.
Initial download of the metrics may take a while.