Fig. 10.
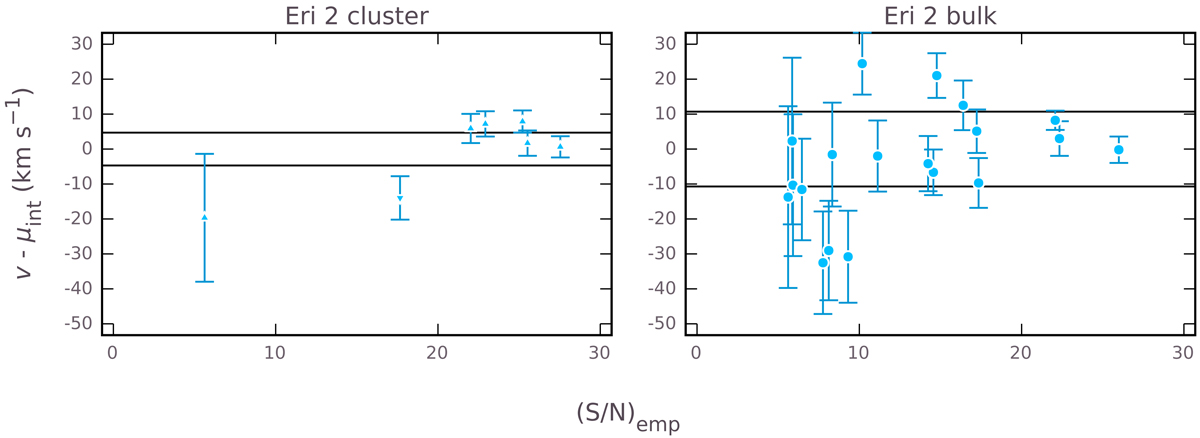
Line-of-sight velocities and measurement uncertainties for stars in Eridanus 2, relative to the intrinsic mean velocity, as a function of signal-to-noise ratio. The possible cluster members are marked with triangles, pointing upwards for those with a high membership probability (∼80−90%) and downwards for the one source with a lower probability (∼60%). The other stars are marked with circles. The black horizontal lines indicate the intrinsic velocity dispersion. The most likely scenario, where all possible cluster member stars are indeed cluster members, is shown. Left: velocities for member stars of the cluster. Right: velocities for stars in the bulk of Eridanus 2.
Current usage metrics show cumulative count of Article Views (full-text article views including HTML views, PDF and ePub downloads, according to the available data) and Abstracts Views on Vision4Press platform.
Data correspond to usage on the plateform after 2015. The current usage metrics is available 48-96 hours after online publication and is updated daily on week days.
Initial download of the metrics may take a while.